How to Track In-Store Conversion Rate with Shopify POS (2026 Guide)
TL;DR — Key Takeaways
- In-store conversion rate = (Transactions ÷ Visitors) × 100. It tells you what percentage of people who enter your store actually buy something.
- Shopify Analytics has a blind spot: it tracks online conversion perfectly but says nothing about physical store visitors.
- The solution: pair Shopify POS with a people counter (AI-powered sensors are most accurate at 98%, vs older beam-break tech at 70%).
- Typical benchmarks: Fashion stores convert 15–25% of visitors. Grocery stores: 40–60%. Electronics: 10–20%. Home & garden: 20–30%.
- 5 ways to improve: reduce friction at checkout, improve sightlines, train staff on upselling, optimize layout, and use real-time data.
- You can integrate a people counter into Shopify POS in under 30 minutes with most modern solutions.
Part 1: What Is In-Store Conversion Rate, and Why Does Your Shopify Store Need It?
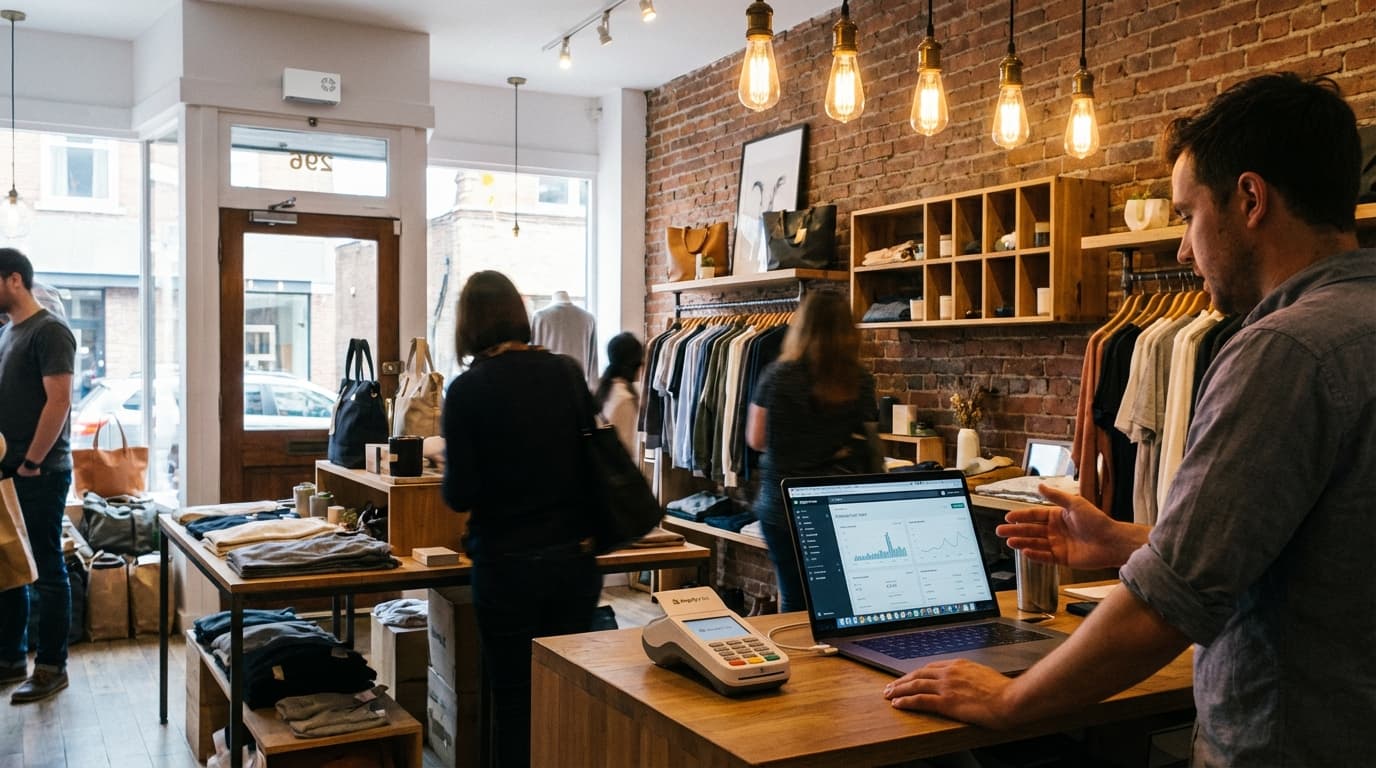
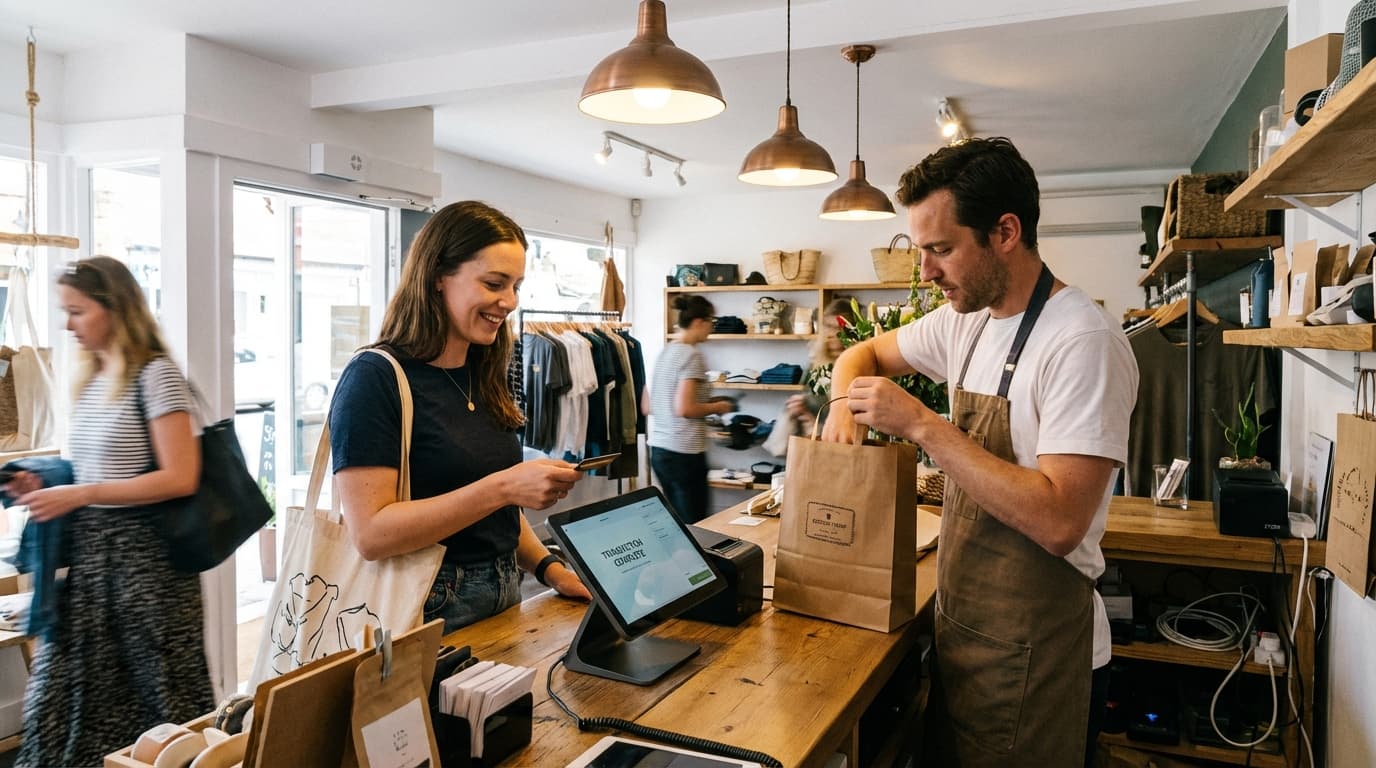
If you run a physical retail location, you're already tracking sales with Shopify POS. But there's a critical metric you're probably missing: in-store conversion rate.
Here's the gap: Shopify POS tells you what sold and how much revenue came in. It does not tell you how many people walked past your door or what percentage of them bought. That's the blind spot.
The Math: A Worked Example
The formula is simple:
In-Store Conversion Rate = (Transactions ÷ Visitors) × 100
Let's say your fashion boutique had 500 visitors and 75 transactions on Tuesday.
- (75 ÷ 500) × 100 = 15% conversion rate
That tells you something important: 1 in 7 people who entered your store bought something. Is that good? Is that bad? Depends on your category (see benchmarks below). But now you have a metric to track week-over-week and improve.
Why Shopify Retailers Overlook This
Shopify POS excels at transaction data:
- Which products sold most
- Staff performance and commissions
- Customer profiles and repeat visitors
- Inventory levels
But it requires a people counter to answer:
- How many potential customers walked past?
- What's our true conversion rate?
- Are we losing sales due to foot traffic or conversion efficiency?
- Which marketing campaigns drive physical visits (not just online clicks)?
Without that data, you're flying blind on one of retail's most important KPIs.
Part 2: Why Shopify Analytics Shows Only Online Conversion
Let's clarify: if you have an online Shopify store, Shopify Analytics reports your online conversion rate perfectly. It tracks:
- Website visitors (via Google Analytics integration)
- Transactions completed online
- Conversion rate = transactions ÷ sessions
But if you also have a physical store, Shopify gives you no visibility into:
- How many people physically entered the store
- How many of those people bought
So you might see "3% online conversion rate" in Shopify, but have no idea if your brick-and-mortar location converts at 18% or 8%. These are two completely different businesses and need separate metrics.
Part 3: How to Connect a People Counter to Shopify POS
Modern people counters use AI-powered computer vision to detect and count visitors as they enter. They integrate with Shopify POS via native apps or API integrations.
Step 1: Choose Your People Counter Technology
There are several technologies:
| Technology | Accuracy | Ease of Setup | Cost | Best For |
|---|---|---|---|---|
| AI Vision (3D cameras) | 98% | 15–30 min | £60–150/mo | Any retail type; future-proof |
| Thermal Sensors | 85–90% | 20–40 min | £40–80/mo | Fashion, grocery, footwear |
| Infrared Beams | 90–95% | 10–20 min | £30–60/mo | Doorways (single exit/entry) |
| Beam-Break (Budget) | 70–80% | 5–10 min | £20–40/mo | Very price-sensitive only |
For 2026, AI vision cameras are the gold standard. They work in any lighting, handle multiple entry/exit points, and integrate natively with Shopify POS.
Step 2: Install the Hardware
Most AI vision counters mount above or beside your entrance. Installation:
- Mount the camera (usually a small white or black box, 4–5 inches wide).
- Plug into power (most are mains-powered with a backup battery).
- Connect to Wi-Fi (2.4GHz or 5GHz).
- Calibrate in the app (usually just a 2–3 minute walk-through).
Real time: 15–30 minutes for the entire install.
Step 3: Link to Shopify POS
If your people counter has a native Shopify app:
- Open the Shopify App Store and search for it (e.g., "Hoxton Convert").
- Click "Add app" and authorize access to your Shopify POS location.
- The counter starts sending visitor data to Shopify POS automatically.
If it uses API integration:
- Get your API keys from the people counter's dashboard.
- Add them to Shopify settings or ask the vendor's support team.
- Test by walking past the counter and seeing the data appear in your Shopify dashboard within 30 seconds.
Step 4: Start Collecting Footfall Data
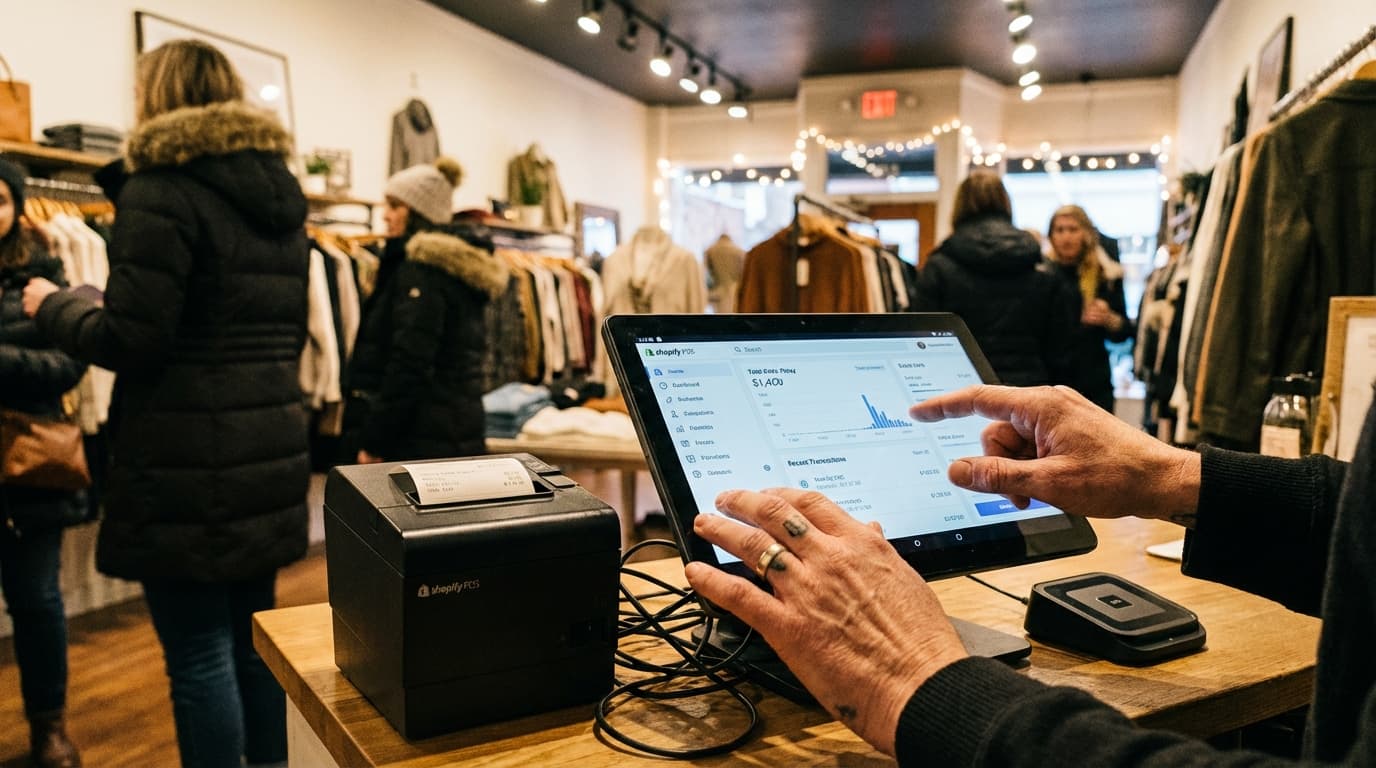
Once connected, you'll see in your Shopify POS dashboard:
- Daily/hourly visitor counts
- Transactions for that same period
- Automatic conversion rate calculation
- Trends and peak hours
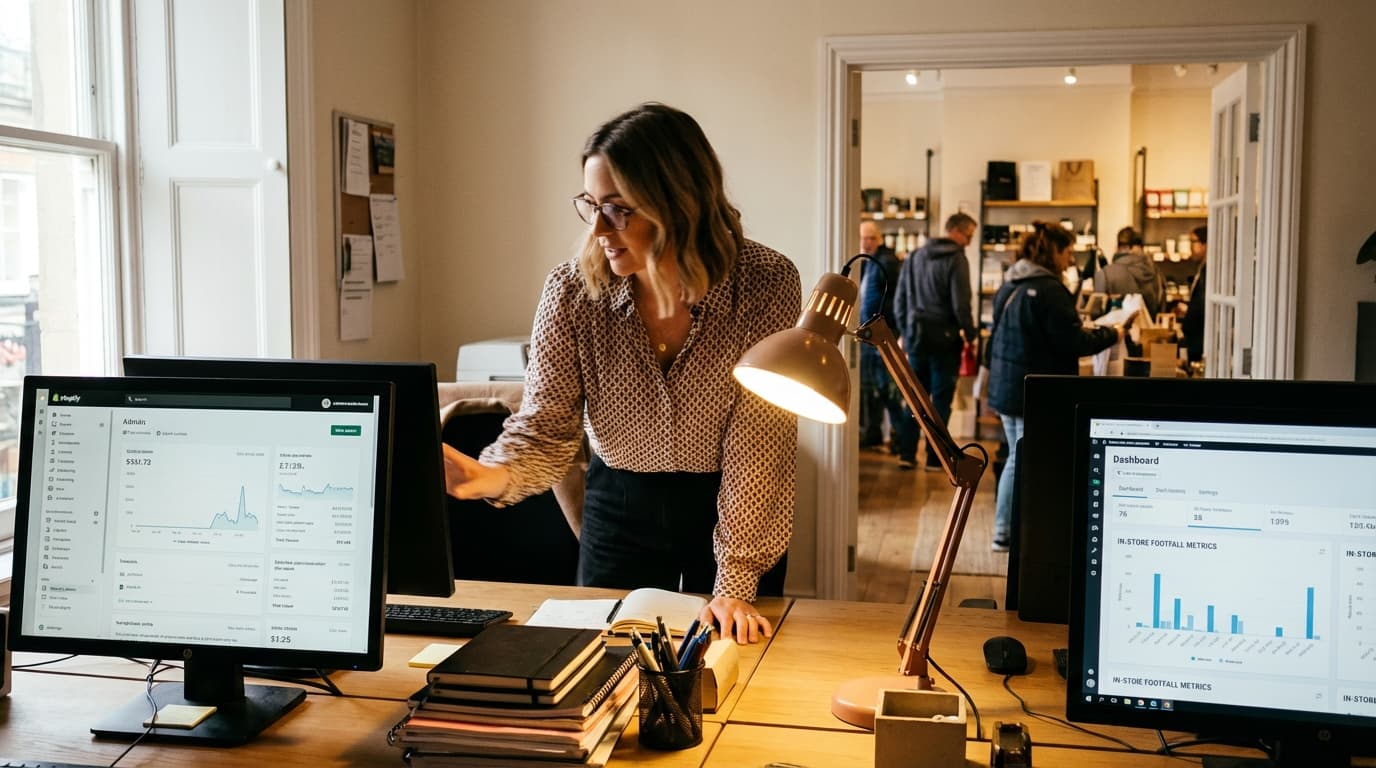
Part 4: How to Read Combined Footfall + Sales Data
Once your people counter is live, you'll have a richer data picture.
Daily Dashboard Example
| Day | Visitors | Transactions | Conversion Rate | Revenue |
|---|---|---|---|---|
| Monday | 120 | 18 | 15.0% | £1,440 |
| Tuesday | 95 | 14 | 14.7% | £1,120 |
| Wednesday | 180 | 30 | 16.7% | £2,010 |
| Thursday | 110 | 16 | 14.5% | £1,280 |
| Friday | 220 | 44 | 20.0% | £3,520 |
| Saturday | 310 | 62 | 20.0% | £4,960 |
| Week Total | 1,035 | 184 | 17.8% | £14,330 |
What This Data Reveals
- Conversion stability: Your store converts at ~17.8% all week. This is consistent and healthy for a mid-market fashion retailer.
- Peak days: Friday–Saturday see higher foot traffic and conversion. This tells you your staffing and stock should peak on these days.
- Wednesday spike: You had 180 visitors but only 16.7% conversion—slightly below average. Was there a markdown event? A complimentary class? You've now got a clue to investigate.
- Revenue per visitor: Divide total revenue by total visitors: £14,330 ÷ 1,035 = £13.84 per visitor. This is your blended "transaction value" metric. If it drops, conversion rates fell or average order value fell.
The Insight You Can't Get from Shopify Alone
Without footfall data, you'd see:
- "Revenue this week: £14,330. Great!"
With footfall data, you see:
- "Revenue this week: £14,330 from 1,035 visitors. Conversion is 17.8%, which is 2.2% above our 15.6% target. Staff efficiency on Friday–Saturday is excellent—let's replicate that upsell technique."
The second version is actionable.
Part 5: In-Store Conversion Benchmarks by Retail Category
Conversion rates vary wildly by retail type. Here's what you should expect in 2026:
Fashion & Apparel
- Typical range: 15–25%
- Drivers: Styling advice, fitting rooms, staff knowledge, seasonal collections
- Why lower than grocery: Lower purchase frequency; people browse more
Grocery & Food
- Typical range: 40–60%
- Drivers: High daily foot traffic, repeat customers, low decision-making time
- Why higher: Need-based (shopping for food), regular habits
Electronics & Computing
- Typical range: 10–20%
- Drivers: High price points, long consideration periods, staff expertise
- Why lower: Customers research extensively before buying; high abandonment
Home & Garden
- Typical range: 20–30%
- Drivers: Seasonal demand, project-based purchases, visual merchandising
- Why variable: Peaks during DIY seasons; holidays; weather
Footwear & Accessories
- Typical range: 18–28%
- Drivers: Styling, sizing, comfort testing, impulse add-ons
- Why strong: Quick purchase decisions once customer is in-store
Pharmacy & Health
- Typical range: 45–70%
- Drivers: Purposeful shopping, regular visits, necessity purchases
- Why very high: Customers come in to buy something specific
Part 6: Five Practical Ways to Improve Your In-Store Conversion Rate
Once you're tracking conversion, you can improve it. Here are five evidence-based tactics:
1. Reduce Friction at Checkout
The tactic: Every second a customer waits in line is lost conversion.
What to measure: Average queue length + queue wait time via your camera or POS data.
Action: If Friday–Saturday queues exceed 2 minutes, add a second checkout. Train staff on speed (scanning, bagging, payment). Consider a "self-checkout" or contactless quick-pay option.
Expected impact: 2–5% conversion gain.
2. Improve Sightlines & Visual Merchandising
The tactic: If customers don't see your best products in the first 10 seconds, they don't convert.
What to measure: Footfall patterns (your camera can show "dead zones" where people never walk) and dwell time (how long they linger).
Action: Place bestsellers or high-margin items at eye level near the entrance. Remove clutter blocking the view into the store. Use mirrors to create depth and expand the perceived space.
Expected impact: 3–8% conversion gain.
3. Train Staff on Upselling & Assistance
The tactic: A friendly greeting cuts abandonment dramatically.
What to measure: Conversion rate by staff member (Shopify POS tracks this). Footfall data shows when staff are present.
Action: Identify your highest-converting staff. Ask them what they do differently. Train others. Ensure someone is always visible when visitors enter.
Expected impact: 5–15% conversion gain (highly variable by staff skill).
4. Optimize Store Layout for Impulse & Cross-Selling
The tactic: How customers move through your store dictates what they buy.
What to measure: Conversion rate by product category. Footfall heatmaps (time spent in each zone).
Action: Move high-impulse items (phone chargers, gift cards, seasonal) to checkout. Place complementary products near each other (e.g., jeans next to belts). Test a new layout for 2 weeks and measure the conversion rate change.
Expected impact: 4–10% conversion gain.
5. Act on Real-Time Data
The tactic: Conversion rate isn't useful if you check it monthly. Real-time data lets you react immediately.
What to measure: Hourly visitor vs. transaction data. Compare 9am–12pm on Monday to 9am–12pm last Monday.
Action: If conversion dips unexpectedly, walk the floor. Is a main product out of stock? Is a staff member sick (reducing service quality)? Is a competitor running a promotion outside? Real-time insight helps you diagnose and fix within hours, not weeks.
Expected impact: 2–7% conversion gain (through rapid diagnosis).
Part 7: How Hoxton Convert Fits Into This Picture
At this point, you've learned what in-store conversion rate is and how to improve it. The last piece is the tool to measure it.
Hoxton Convert is an AI-powered people counter built for Shopify retailers. It uses 3D computer vision (the most accurate technology) to count visitors with 98% accuracy, integrates natively with Shopify POS via a simple app, and sets up in under 30 minutes with no technical knowledge required.
Other solutions exist (thermal, infrared, beam-based), and some are cheaper upfront. But Hoxton Convert was built specifically for Shopify retailers, so the integration is seamless and the accuracy is best-in-class.
This is not an endorsement of Hoxton Convert as the only solution. Rather, it's one well-built option in a landscape of people-counting technologies. What matters most is that you choose something and start tracking.
Part 8: Getting Started — The Next 30 Minutes
- Audit your current setup: Do you have a Shopify POS location? Do you have a physical store?
- Choose a people counter: Research options in your market. Look for 95%+ accuracy, native Shopify integration, and sub-30-minute setup.
- Install the hardware: Typically 15–30 minutes.
- Connect to Shopify POS: Usually automatic via the app store, or 10 minutes via API.
- Set a baseline: Track your conversion rate for one full week. Note peak days, slow days, and anomalies.
- Implement one tactic: Pick one of the five improvements above (e.g., "reduce checkout queue"). Measure the change in conversion rate after one week.
That's it. You've just become a data-driven retailer instead of a guessing retailer.
Key Takeaways
- In-store conversion rate is the percentage of visitors who buy. It's invisible without a people counter.
- Shopify POS tracks sales but not visitors, leaving a critical analytics blind spot.
- AI vision cameras are 2026's gold standard (98% accuracy, easy setup, Shopify-native integration).
- Benchmarks vary: Fashion 15–25%, grocery 40–60%, electronics 10–20%, home & garden 20–30%.
- Five quick wins: reduce checkout friction, improve sightlines, train staff, optimize layout, act on real-time data.
- Setup is fast: hardware in 15–30 minutes, Shopify integration in under 5 minutes.
Ready to See Your In-Store Conversion Rate?
Stop flying blind. Connect Hoxton Convert to your Shopify POS and see your in-store conversion rate today. 98%+ accuracy, 15-minute install.
Related Reading
- What Is Conversion in Retail? A Beginner's Guide
- Hoxton Convert: Shopify People Counter
- Hoxton Convert: Overview
Last updated: February 2026