You’ve decided to collect feedback from your visitors. Good move. But now you’re faced with a decision that seems simple on the surface but has real implications: How do you actually collect it?
Should you install a physical kiosk at the entrance? Print QR codes on signage? Deploy tablets on stands? Each method has distinct trade-offs—in cost, infrastructure, engagement, and reliability. Pick the wrong one and you’ll either waste money or worse, collect feedback so sparse it’s practically useless.
This guide cuts through the noise. We’ll compare the three most popular feedback collection methods, show you the real-world trade-offs, and help you choose the one that fits your venue, budget, and audience.
Understanding Your Three Main Options
Before diving into pros and cons, let’s be clear about what we’re comparing:
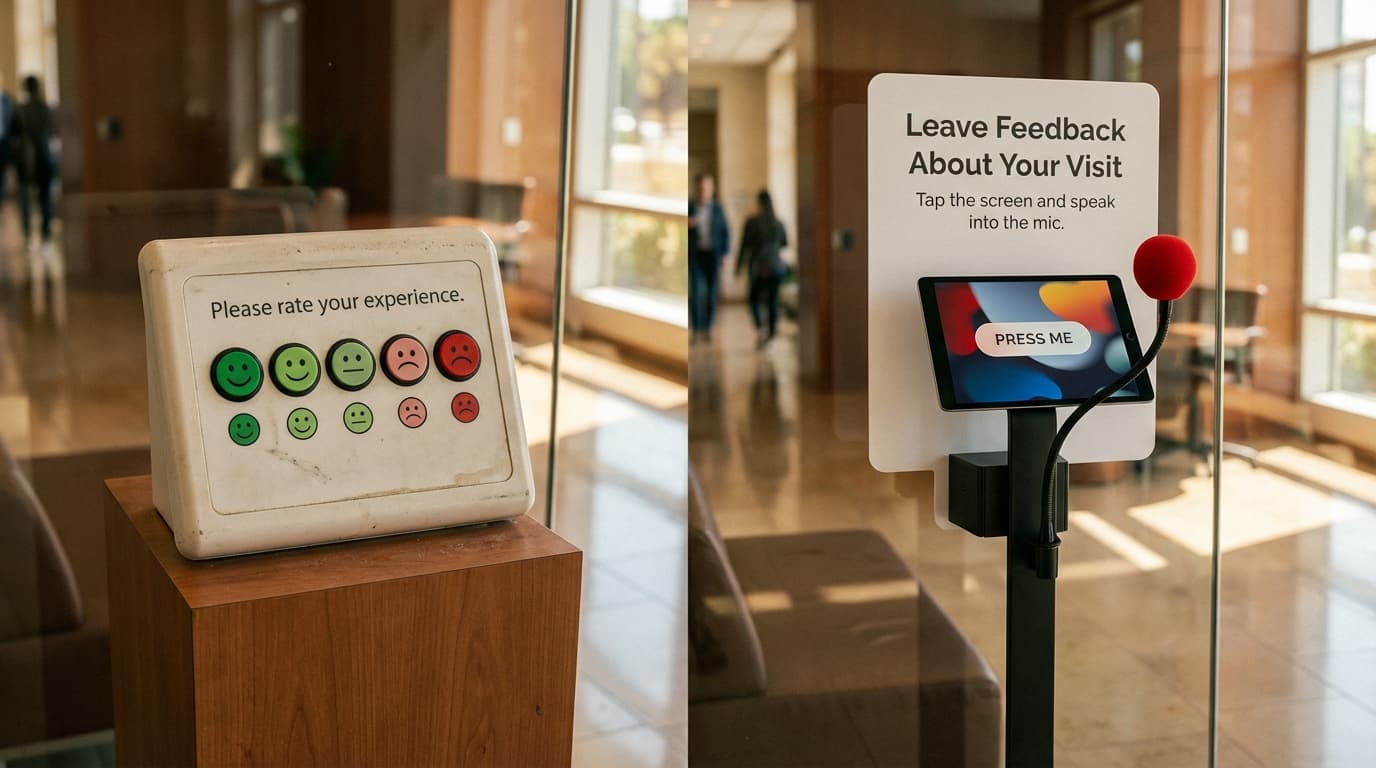
Feedback Kiosk: A standalone, usually floor-standing device where visitors interact with a screen to provide feedback. Can be interactive touchscreen, voice-based, or a combination. Typically placed at venue exits, entrance foyers, or high-traffic areas.
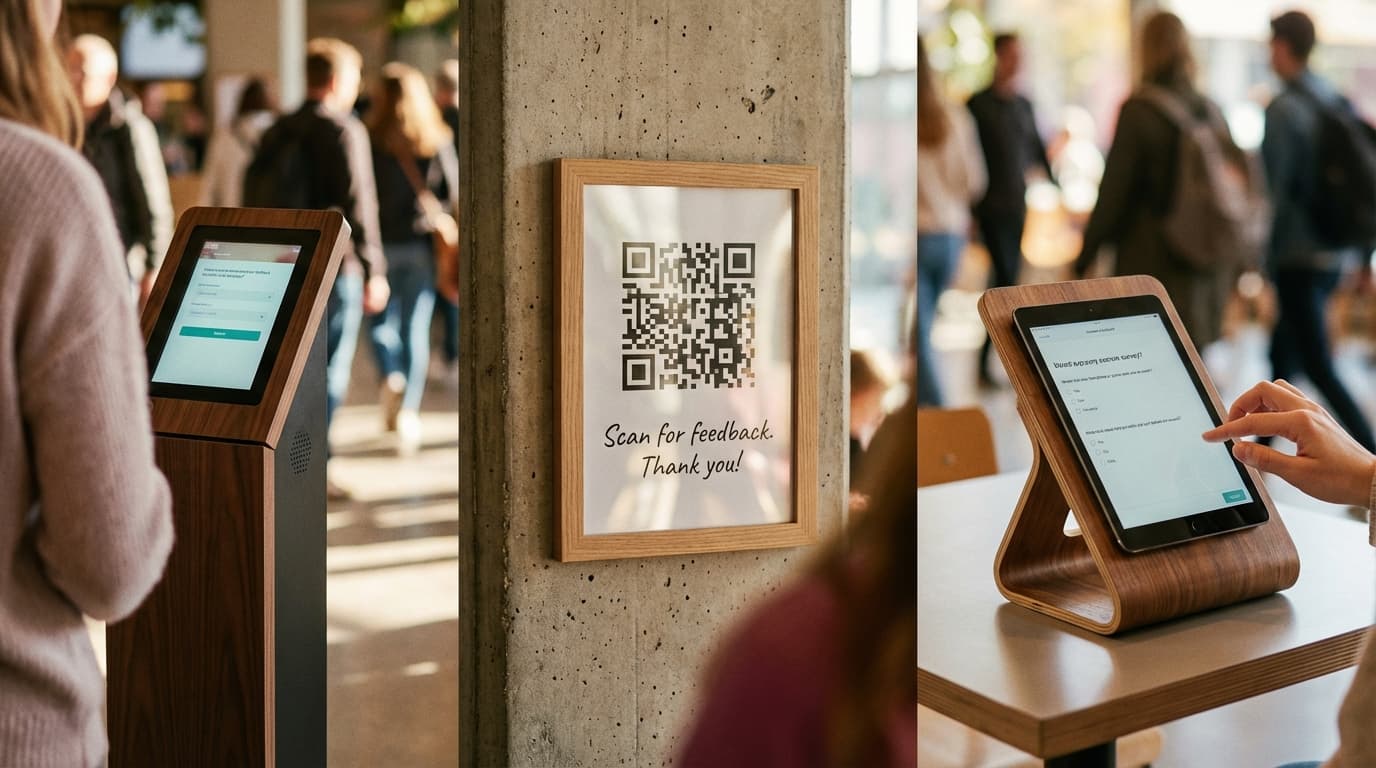
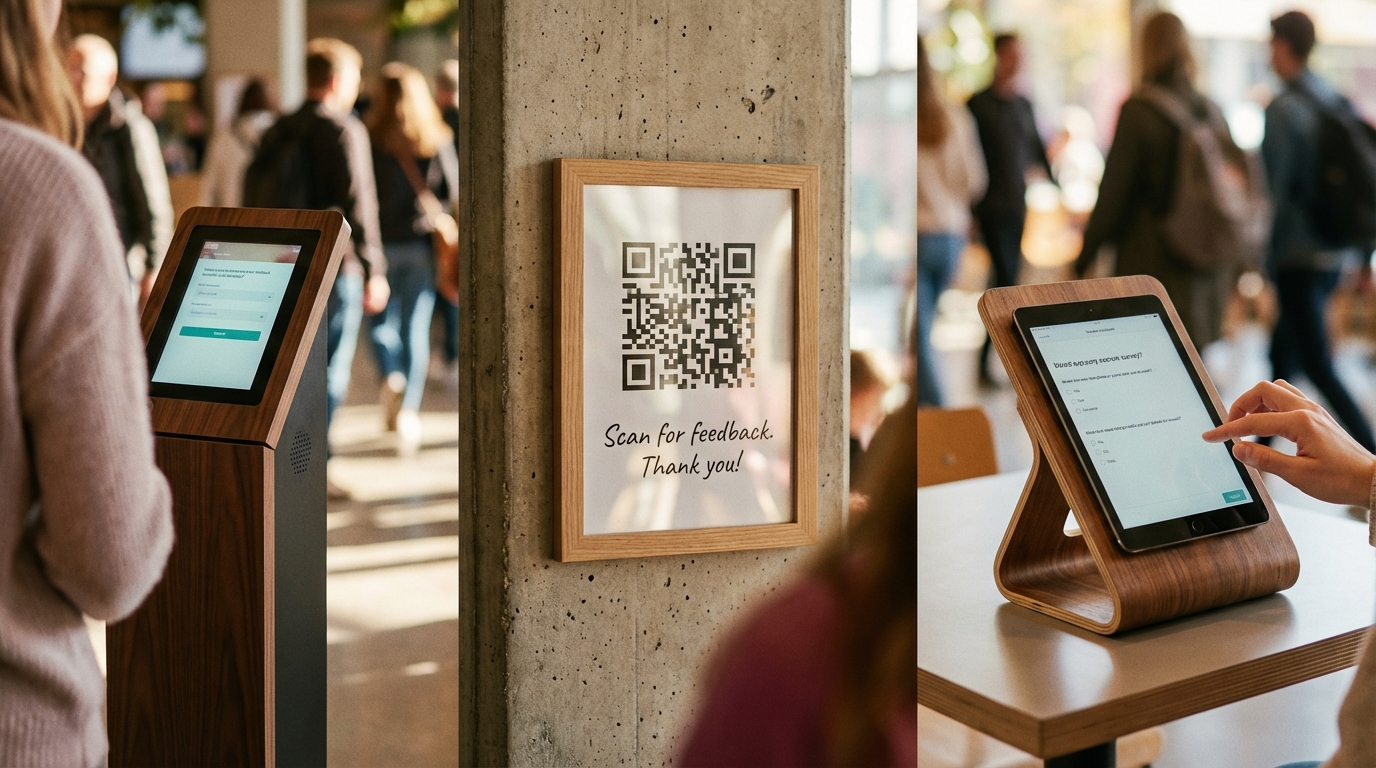
QR Code Survey: A scannable code placed on signage, printed materials, or digital displays. Visitors scan with their phone and complete a survey directly in their browser.
Feedback Tablet: A tablet (iPad, Android, etc.) mounted on a stand or held by staff. Can be positioned flexibly throughout the venue.
Each represents a different philosophy: kiosks say “your feedback is important enough to merit dedicated hardware”; QR codes say “we want you to use your own device”; tablets say “we want to capture feedback anywhere we place staff.”
Detailed Comparison: Kiosks
What It Is
A self-contained, floor-standing or wall-mounted device, typically 30-48 inches tall, with a touchscreen and built-in audio/video.
Pros
Visibility & Credibility
A kiosk is there. It’s impossible to miss. Visitors see it and immediately understand “this venue cares about my feedback.”
High Engagement Rates
Because kiosks are dedicated, visible, and often novel, they drive higher response rates. Expect 8–15% of visitors to use a well-placed kiosk. Compare that to 1–3% for QR codes.
Structured Environment
Kiosk interactions happen in a controlled setting. The screen is at a standard height, lighting is consistent, audio is contained. This reduces variation and improves data quality.
Accessibility Support
Modern kiosks can include audio guides, large text, high-contrast modes, and voice interaction—making feedback accessible to visitors with vision or mobility impairments.
Real-Time Analytics
Most kiosk systems push data directly to a cloud dashboard. You see response trends in real time.
No Visitor Friction
A visitor doesn’t need a phone with a working camera, data plan, or patience to scan. They just touch the screen.
Cons
Hardware & Infrastructure Cost
A decent kiosk costs £3,000–£8,000+ upfront, before software, setup, and installation.
Physical Space Required
Kiosks need floor or wall space and must be positioned carefully to avoid congestion.
Power & Connectivity Dependency
Kiosks must be plugged in and need WiFi or a data connection for real-time reporting.
Maintenance & Support
Touch screens can fail. You need someone who can troubleshoot or a service plan.
Vandalism Risk
A physical device in a public space can be vandalized. Most vendors provide anti-vandalism casings.
Best For
- Museums and cultural attractions
- Retail locations and stores
- Hotels and hospitality venues
- Theme parks and entertainment venues
- High-traffic, permanent installations
- Audiences with lower tech adoption
Cost Model
Upfront: £3,000–£8,000 | Monthly: £100–£300 | Payback: 18–36 months
Detailed Comparison: QR Code Surveys
What It Is
A printed or digital QR code that links to a survey hosted on your cloud platform. Visitors scan with their phone camera and complete the survey in their browser.
Pros
Near-Zero Hardware Cost
After initial setup, a QR code costs virtually nothing.
No Installation Complexity
Print a sign, laminate it, and put it anywhere.
Flexibility & Mobility
Place QR codes everywhere—on signage, lanyards, printed programs, digital screens.
Scalability
One QR code can link to multiple surveys with conditional logic.
No Maintenance
A printed QR code never breaks.
Personal Device Comfort
Many people prefer using their own phone—it feels less intrusive.
Cons
Requires Active Participation
A visitor must notice the QR code, understand what it is, and choose to scan it. Response rates typically range from 1–5%.
Phone-Dependent
No smartphone means no participation.
Data Connectivity Required
The visitor must have WiFi or mobile data to complete the survey.
Lower Perceived Importance
A QR code on a poster feels ephemeral—like an afterthought.
Harder to Encourage Participation
Without active staff promotion, adoption is sporadic.
Best For
- Tech conferences and digital-forward events
- Low-budget implementations
- Audiences aged 18–45
- Temporary activations or pop-up events
- Secondary feedback channel
Cost Model
Upfront: £200–£500 | Monthly: £20–£50 | Payback: Already achieved
Detailed Comparison: Feedback Tablets
What It Is
A tablet running survey software, mounted on a stand or held by staff. Typically protected in a weatherproof case.
Pros
Moderate Cost
A tablet + stand + case costs £800–£2,000—more than QR codes but far less than a kiosk.
Flexibility in Placement
Unlike kiosks, tablets can move. Staff can bring them to customers.
Easier Installation
No drilling, wiring, or complex setup. Drop the tablet in a stand and connect to WiFi.
Multi-Purpose Device
When not collecting feedback, a tablet can display promotional content or other messages.
Cons
Staff Dependency
Tablets often require staff to present them to visitors.
Battery Life Constraints
A full day of interaction can drain a battery.
Durability Concerns
Tablets are consumer devices. Scratches, drops, and wear take a toll faster than ruggedized kiosks.
Privacy Concerns
Providing feedback on a tablet held by staff feels less private than a kiosk.
Best For
- Retail locations with staff engagement
- Small-to-medium venues
- Roaming events or trade shows
- Hybrid staffing models
Cost Model
Upfront: £800–£2,000 | Monthly: £100–£200 | Payback: 12–24 months
Comparison Table: Side-by-Side
| Factor | Kiosk | QR Code | Tablet |
|---|---|---|---|
| Upfront Cost | £3,000–£8,000 | £200–£500 | £800–£2,000 |
| Monthly Cost | £100–£300 | £20–£50 | £100–£200 |
| Response Rate | 8–15% | 1–5% | 3–8% |
| Requires Visitor Phone | No | Yes | No |
| Space Required | Dedicated floor/wall | None | Minimal |
| Maintenance Burden | Medium-High | None | Low-Medium |
| Accessibility | Excellent | Moderate | Good |
| Real-Time Monitoring | Excellent | Good | Good |
| Best for Older Audiences | Excellent | Poor | Good |
| Visible & Memorable | Excellent | Poor | Good |

Choosing by Venue Type
Museums & Cultural Attractions
Recommended: Kiosk (primary) + QR code (secondary)
Museums have older, diverse audiences with lower smartphone adoption. A visible kiosk at the exit captures broad participation. QR codes on exhibition materials serve tech-forward visitors.
Retail & Commercial Venues
Recommended: Tablet (primary) + QR code (secondary)
Tablets allow staff to engage customers at point-of-purchase. QR codes on receipts or signage serve self-directed visitors.
Events & Conferences
Recommended: QR code (primary) + voice kiosk (optional)
Events are temporary and tech-forward audiences dominate. Voice kiosks capture multilingual feedback for international conferences.
Hotels & Hospitality
Recommended: Kiosk (primary) + QR code (secondary)
A visible kiosk at checkout is hard to ignore. QR codes on the bill or room signage capture the privacy-seeking segment.
Attractions & Theme Parks
Recommended: Kiosk (primary)
High visitor volume justifies the cost. Diverse audiences benefit from accessible kiosk design.
Pop-Up Events
Recommended: QR code (primary) + tablet (optional)
No budget for kiosks. QR codes are instant and cheap.

The Hybrid Approach: Best of All Worlds
Many successful venues use multiple methods:
- Entrance/exit kiosk (catches high-volume feedback)
- QR codes on materials (serves digitally native visitors)
- Roaming staff with tablets (captures feedback from engaged visitors)
This maximizes response rates, provides data redundancy, and allows A/B testing of which method works best for your venue.
Voice-Powered Kiosks: A Special Case
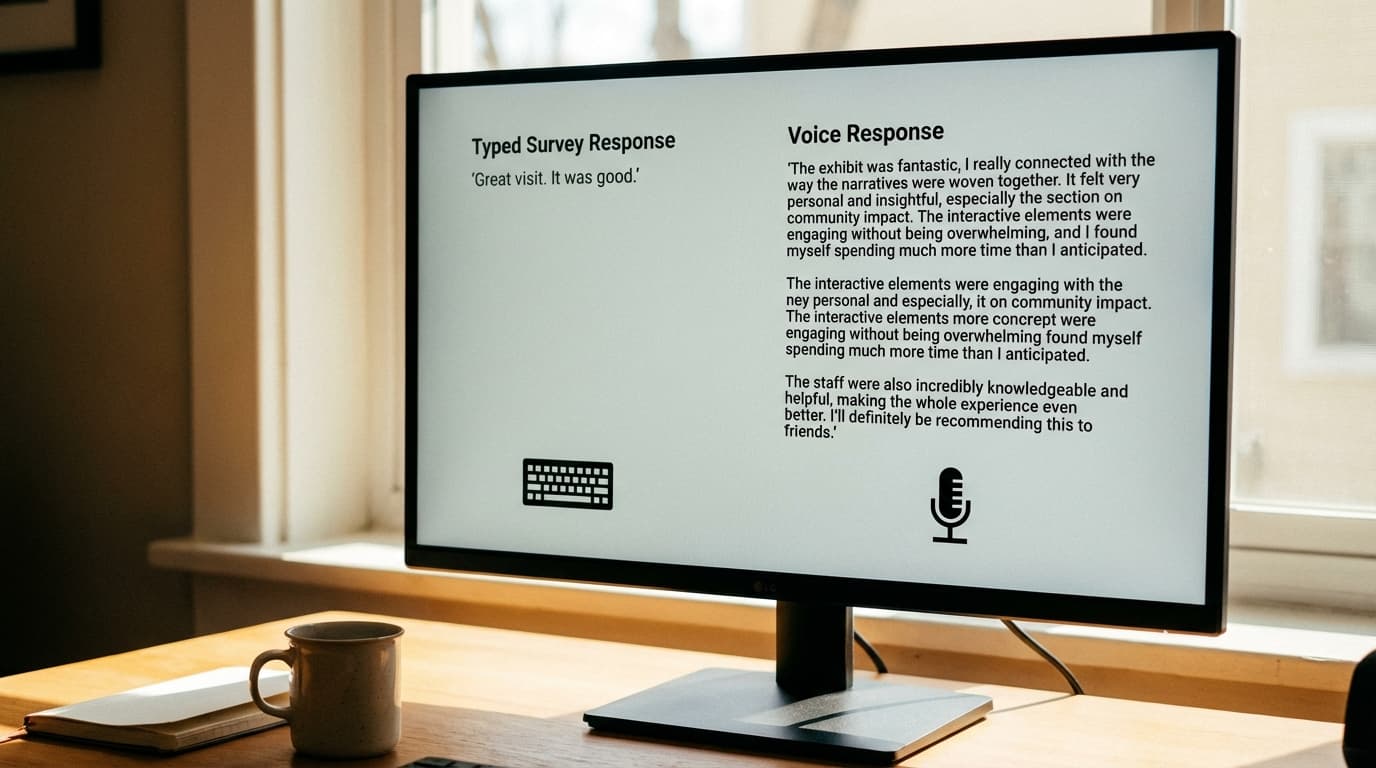
One subset of kiosks deserves particular mention: voice-based feedback kiosks, where visitors speak their feedback and AI transcribes and analyzes it in real time.
Why voice is different:
- Fastest engagement: Speaking takes 20 seconds; typing takes 2+ minutes.
- Richer data: Tone, emotion, and inflection come through in voice.
- Multilingual: Real-time transcription and translation across languages.
- Highest accessibility: Works for people with motor impairments, vision impairments, or low literacy.
- Authentic responses: People speak more naturally than they type.
At venues with diverse, multilingual visitors, voice kiosks—like those powered by SaySo—offer unique advantages.
Technical Considerations
WiFi & Connectivity
All digital methods depend on WiFi. Ensure your venue’s WiFi is robust enough for high-volume use.
Data Privacy & GDPR Compliance
All feedback collection involves personal data. Ensure your platform complies with GDPR and relevant local privacy laws.
Integration with Other Systems
Clarify integration needs upfront—some platforms charge extra for API access.
Availability & Support
For critical feedback systems, choose vendors with strong SLAs and support.
Cost-Benefit Analysis
Ask yourself: How many daily visitors? How critical is feedback? What’s your budget? Who’s your audience? Is the installation permanent or temporary?
For <100 daily visitors, QR codes suffice. For 100–500, tablets or one kiosk. For 500+, invest in kiosks plus QR code backup.
Real-World Case Study
A museum with 800 daily visitors:
- Kiosk only: £5,000 upfront, ~80 responses/day (10%). Cost per response: £1.50.
- QR only: £500 upfront, ~15 responses/day (2%). Cost per response: £3.50.
- Hybrid (Kiosk + QR): £5,500 upfront, ~95 responses/day (12%). Cost per response: £1.75.
The hybrid approach captures 6x more feedback than QR alone, and the data quality is higher. Over a year, that’s 34,675 responses vs. 5,475—a massive difference.

A Final Word on Technology Choice
Your feedback collection method is infrastructure. The best system is the one that works consistently, gets high response rates, produces actionable data, and fits your budget.
And if you’re ready to add voice-powered intelligence—capturing richer qualitative data, supporting multiple languages, and analyzing sentiment in real time—systems like SaySo turn basic feedback collection into a strategic asset.
Ready to choose your feedback system? Learn about voice-powered kiosks, see how other venues collect feedback, or talk to our team about the best fit for you.