Museums and cultural venues face a unique measurement challenge: understanding what visitors truly think about their experience. Yet most institutions still rely on outdated feedback collection methods that capture only a fraction of their audience.
This gap between intention and insight has real consequences. Museums that don’t systematically measure visitor satisfaction miss opportunities to improve exhibitions, wayfinding, accessibility, and overall experience quality. They can’t identify which programs resonate most with different demographics. They remain unaware of the barriers preventing return visits.
This guide explores how museums can measure visitor satisfaction effectively—from traditional comment cards to cutting-edge voice feedback systems—and why the method you choose fundamentally shapes the quality of insights you gather.
Why Visitor Satisfaction Matters
Before discussing measurement methods, it’s worth establishing why this matters beyond operational curiosity.
Visitor satisfaction drives: - Return visits and membership growth - Positive word-of-mouth and social media advocacy - Justified funding and sponsorship renewal - Improved accessibility and inclusivity - Stronger exhibition and programming decisions informed by actual visitor preferences
Museums increasingly compete with unlimited entertainment options. A visitor’s experience at your venue determines whether they return, recommend you to others, or simply forget the visit within weeks.
Measuring satisfaction isn’t optional for institutions serious about growth.
The Problem with Traditional Feedback Methods
Comment Cards and Suggestion Boxes
Comment cards remain the most ubiquitous feedback method in museums. They’re inexpensive, require no technology, and provide a permanent record.
Their limitations are substantial:
Low response rates. Most visitors don’t complete comment cards. Estimates suggest 2-5% of visitors participate, skewing toward visitors with strong opinions (either very satisfied or very dissatisfied). You lose the perspectives of the 95% with neutral or moderate satisfaction.
Selection bias. Comment cards attract passionate extremes. A visitor may be perfectly satisfied but never considers writing feedback. Meanwhile, a frustrated visitor feels motivated to express their displeasure in writing. This creates a distorted representation of the true visitor population.
Time barrier. Writing takes effort. Visitors may decide their feedback isn’t worth the time, or they rush through their comment. Casual observations and mild suggestions never make it onto the card.
No structured data. Comment cards generate unstructured text that’s difficult to quantify. One visitor writes “great exhibition,” another writes three paragraphs. Analyzing patterns requires manual reading and subjective interpretation. Scaling this across hundreds of cards becomes unsustainable.
Language limitation. If your venue hosts international visitors (as most major museums do), you’re capturing feedback only in the languages for which you have comment cards. Non-native speakers often avoid written feedback in a non-native language.
Emotional nuance lost. Text alone doesn’t capture tone, hesitation, or emotional intensity. A typed phrase loses the nuance of how something was said.
Exit Interviews
Some museums conduct brief exit interviews—a staff member asks departing visitors a few standard questions.
Challenges:
- Intrusiveness. Visitors rushing to the exit resent interruptions. The methodology changes visitor behavior by forcing engagement.
- Social desirability bias. Visitors provide more positive answers when a staff member is listening, especially in person. Criticism feels uncomfortable.
- Inconsistency. Each staff member conducts interviews slightly differently, using different follow-ups and interpretations.
- Time intensive. This doesn’t scale. You might collect 50-100 interviews weekly, missing the broader population.
Post-Visit Email Surveys
Email surveys attempt to reach visitors after they’ve left, at a time when they might reflect more deeply.
Their shortcomings:
- Extremely low completion rates. Unless paired with incentives, email surveys achieve 2-8% response rates. Reaching your subscriber list requires collecting email addresses on-site—another barrier.
- Sampling bias. Only tech-savvy, engaged visitors complete email surveys. Older visitors and those without email access disappear from your data.
- Timing lag. By the time an email arrives (often days later), the experience fades from memory. Emotional reactions dull. Specific details blur.
- Survey fatigue. Museums compete with every other organization for survey attention. Long surveys go incomplete.
- Manual transcription. Open-ended responses still require manual reading and coding.
Modern Digital Feedback Methods
Museums increasingly adopt digital solutions to capture visitor feedback more systematically.
Digital Survey Kiosks
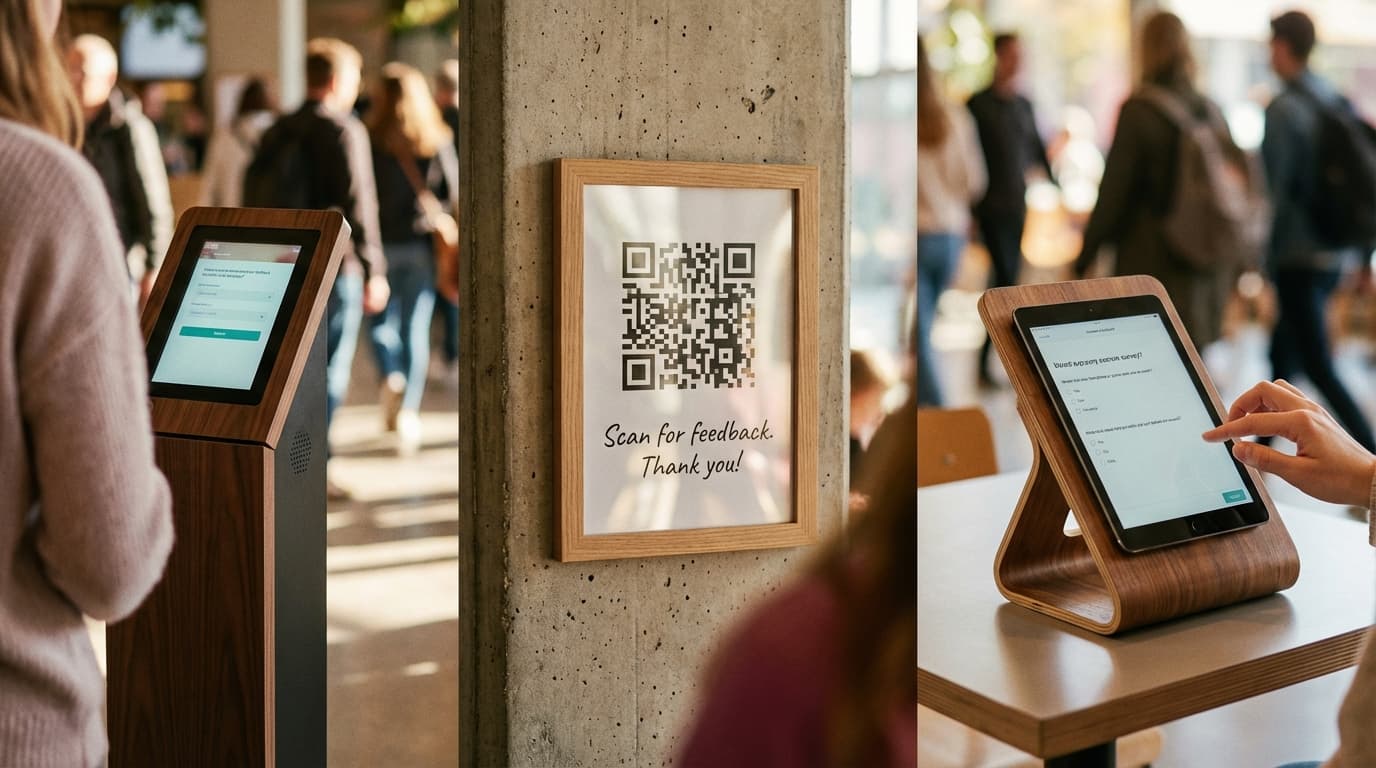
Touchscreen kiosks placed at exit points allow visitors to respond quickly to structured questions—typically ratings on satisfaction, likelihood to recommend, and maybe one open-ended comment.
Advantages:
- Eliminates the paper waste of comment cards
- Structured responses enable quantitative analysis
- Can guide visitors through multi-question surveys
- Responses automatically digitized and archived
Limitations persist:
- Response rates improve over comment cards, but still only capture 10-20% of visitors
- Typing on a touch screen remains a barrier. Visitors rushing to leave often skip open-ended sections.
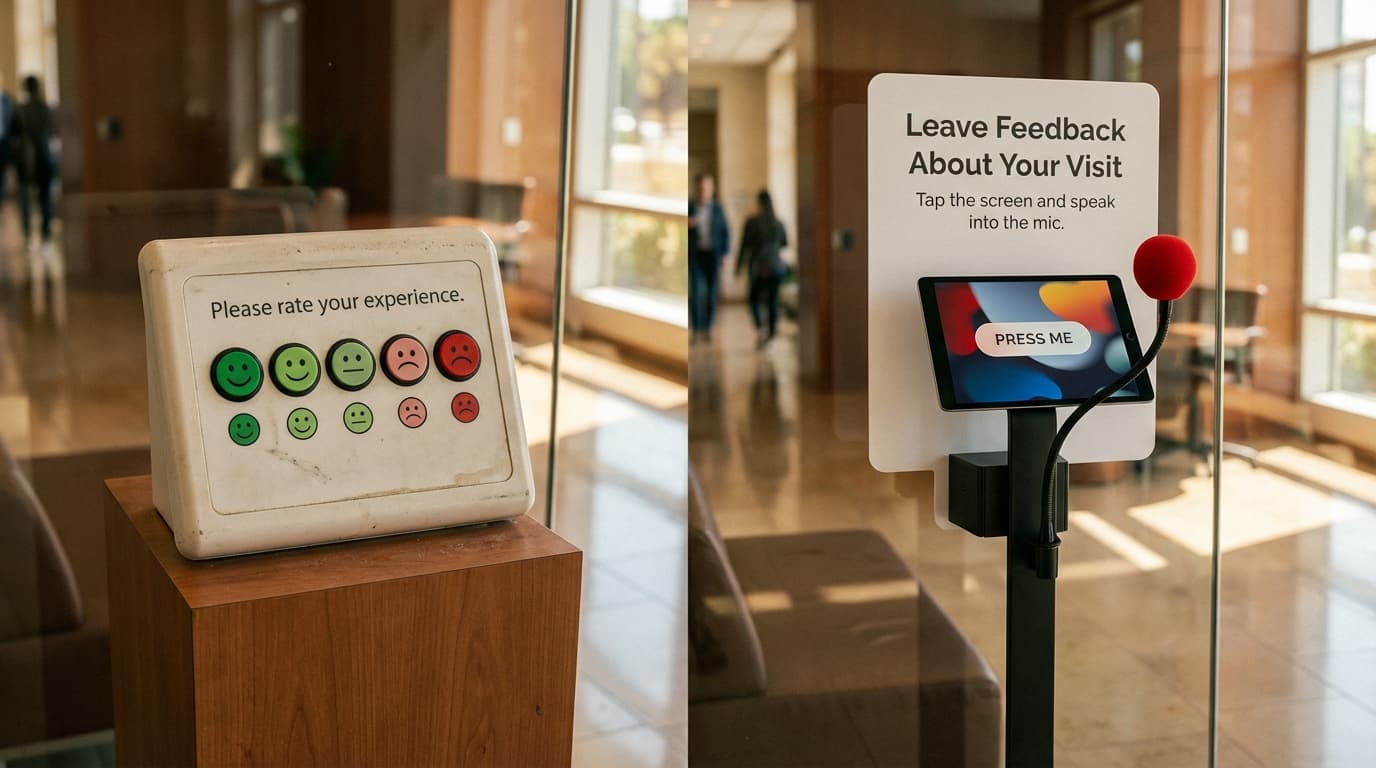
- Smiley-button terminals (popular in retail and transport) reduce response depth even further
- No accommodation for non-English speakers without manual switching
- Doesn’t capture rich qualitative insights, only ratings and brief typed comments
- Analysis of typed open-ended comments still requires manual review
QR Code Feedback Links
Museums increasingly place QR codes throughout venues, linking to mobile survey forms. Visitors scan with their phones to provide feedback.
Benefits:
- Familiar interaction (most visitors have phones)
- Can be placed near specific exhibits for localized feedback
- Mobile surveys are increasingly optimized for user experience
- Lower friction than visiting a fixed kiosk location
Drawbacks:
- Requires visitors to have phones, data, and willingness to engage with a form
- Response rates remain low (typically 3-8%)
- International visitors often lack mobile data; relying on WiFi creates barriers
- Typing on a small screen discourages longer responses
- Skews younger, tech-savvy visitor demographic
The Next Generation: Voice-Powered Feedback
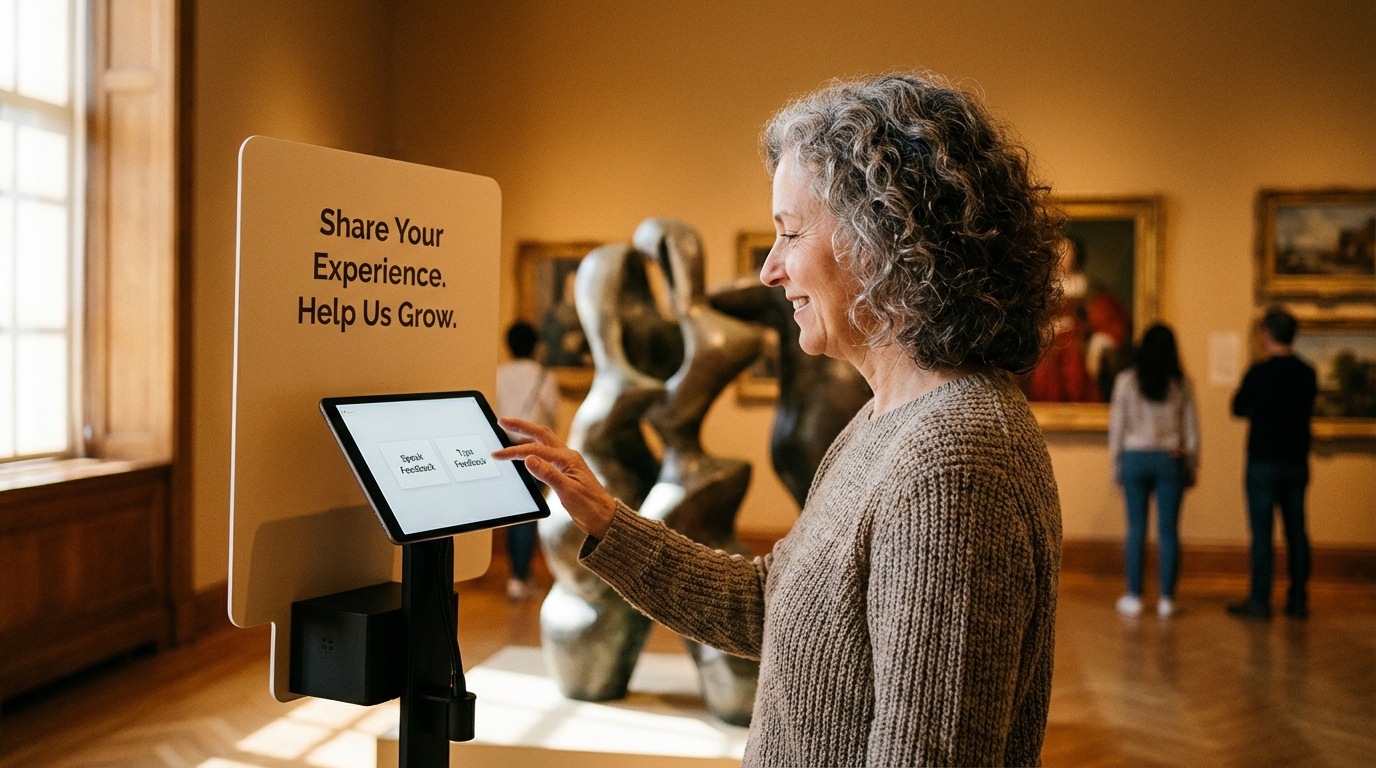
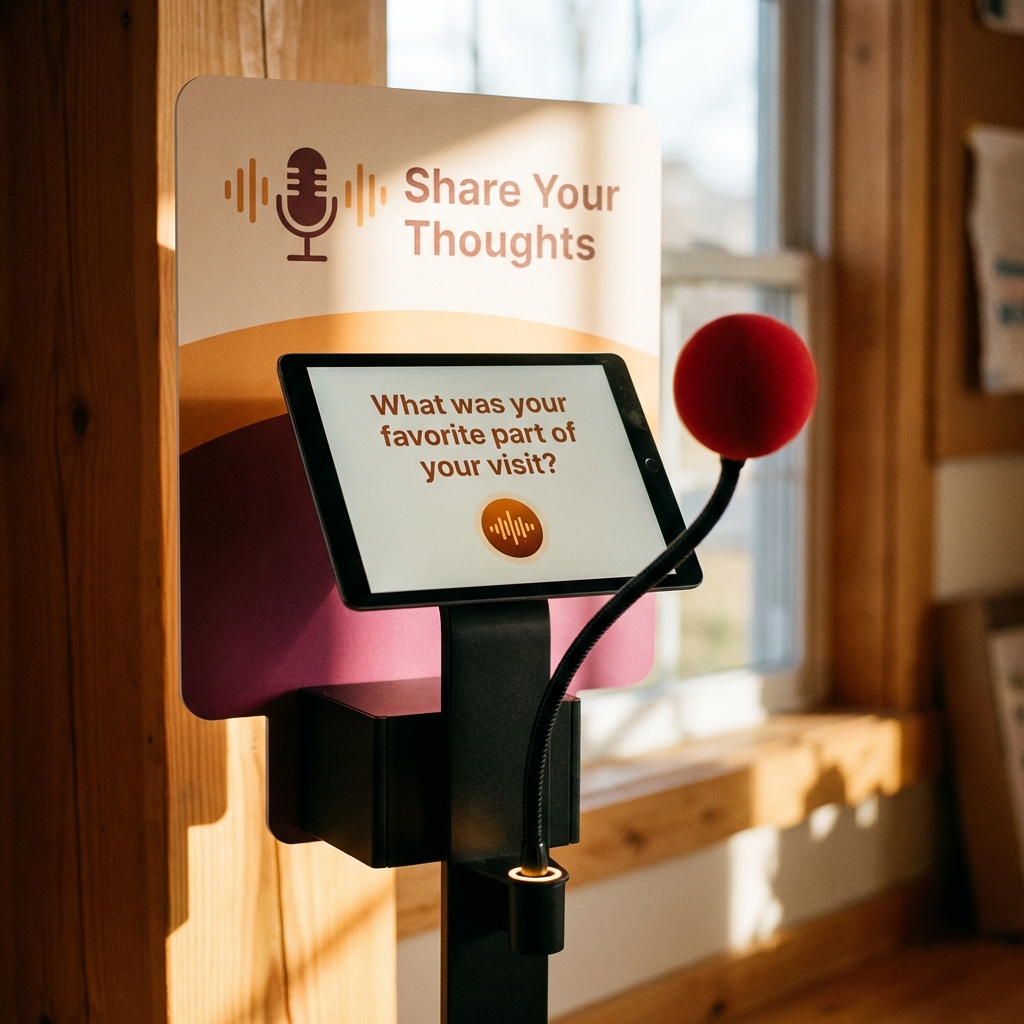
Museums seeking richer, more inclusive visitor feedback increasingly explore voice feedback systems. These devices ask visitors to speak their thoughts aloud, using AI to transcribe and analyze responses.
How Voice Feedback Works
A simple process:
- Prompt. A touchscreen or kiosk displays a question: “What was your favorite part of your visit?”
- Record. Visitor speaks their response into a microphone.
- Transcription. AI immediately transcribes the spoken words.
- Translation. Multilingual AI translates responses into your chosen languages.
- Analysis. Real-time sentiment analysis and keyword extraction identify themes.
Why Voice Captures Better Data
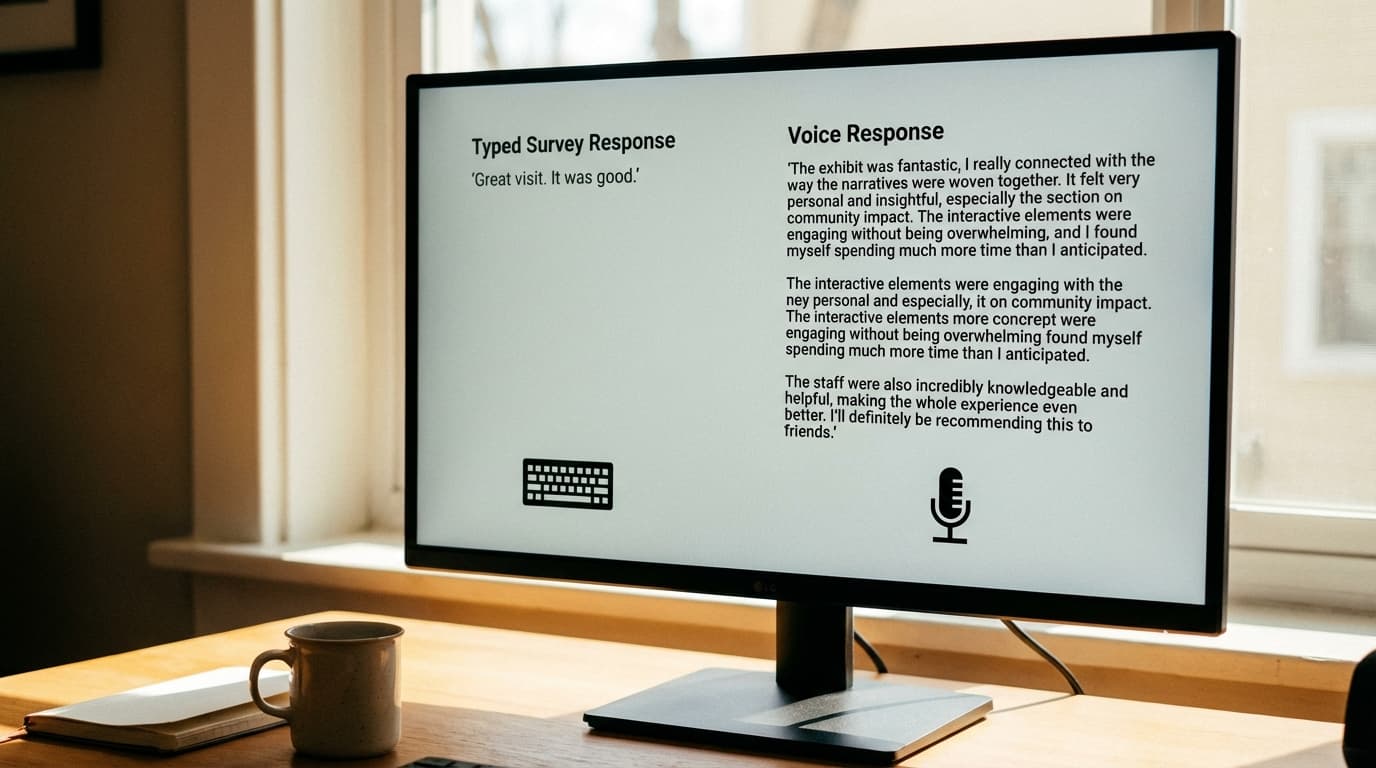
Speech is faster than typing. Research shows speech produces roughly 150 words per minute versus 40 for typing. In the same time a visitor types one sentence, they speak five. Longer responses yield richer qualitative data.
Less self-editing. Typing encourages self-censoring. People revise their thoughts mid-sentence, delete criticism they deem too harsh, or skip thoughts altogether. Speech is more spontaneous. Visitors elaborate on initial thoughts, mention secondary observations, and express nuance they wouldn’t write.
Emotional authenticity. Voice captures tone, hesitation, enthusiasm, and frustration in ways text cannot. A transcribed comment “The exhibition was fine, but…” conveys resignation. Those three words in audio reveal volume, pace, and sincerity.
Lower barrier to participation. Speaking feels more natural than writing for most people. Visitors who might skip a typing interface happily speak their thoughts. Response rates increase from 10-20% to 40-60%.
Inclusivity and Accessibility
Voice feedback addresses accessibility gaps that text-based systems create:
Non-native speakers. A visitor from Japan experiences the museum in English but feels more comfortable expressing nuanced feedback in their native language. Speaking Japanese, which the system translates, removes the language barrier typing creates.
Low literacy visitors. Museums serve all demographics, including visitors with limited literacy. Voice bypasses this barrier entirely.
Visually impaired visitors. Touchscreen kiosks are inaccessible to blind visitors. Voice-powered systems work independently of visual interface.
Elderly visitors. Many older visitors find typing difficult due to arthritis or reduced dexterity. Speaking presents no such challenge.
Parents with children. A parent holding a child or managing a toddler can speak feedback hands-free.
Multilingual Advantage
International visitors represent significant museum revenue and growth opportunity. Traditional methods capture feedback only in languages with available comment cards or survey translations.
Voice feedback systems transcribe and translate in real time. A visitor speaks in Mandarin, the system transcribes it, and translates it to English for analysis—all within seconds. This transforms international visitors from a measurement blind spot into a primary data source.
For museums in major tourism destinations, this capability alone justifies the technology investment.
Key Visitor Satisfaction Metrics
Whatever measurement method you choose, focus on these core metrics:
Net Promoter Score (NPS)
A single question captures overall satisfaction: “How likely are you to recommend this museum to a friend?”
Visitors rate 0-10. Scores of 9-10 are “promoters” (loyal advocates), 7-8 are “passives” (satisfied but not zealous), 0-6 are “detractors” (unsatisfied, may discourage others).
NPS = % Promoters − % Detractors
For museums, benchmarks typically range 40-60. Top-tier museums exceed 70.
Why NPS matters: It’s a leading indicator of growth. Promoters drive word-of-mouth, repeat visits, and membership. Tracking NPS over time reveals whether your improvements actually move the needle.
Customer Satisfaction (CSAT)
A simpler metric: “How satisfied were you with your visit today?” on a 1-5 scale.
CSAT = (Satisfied responses / Total responses) × 100
CSAT is more intuitive than NPS but less predictive of behavior. It’s useful for quick pulse checks.
Sentiment Analysis
With text and voice feedback, sentiment analysis automatically categorizes responses as positive, neutral, or negative—and measures intensity.
A comment “The Vermeer gallery was incredible, though the audio guide was hard to hear” breaks into: - Positive sentiment: “incredible” - Negative sentiment: “hard to hear” - Topic tags: “gallery,” “audio guide”
This allows museums to identify which specific elements drive satisfaction or frustration.

Qualitative Themes
Beyond metrics, what are visitors actually saying? Coded analysis of open-ended feedback reveals:
- Most praised elements (specific exhibitions, staff helpfulness, architecture)
- Pain points (wayfinding, facilities, accessibility barriers, pricing)
- Unexpected feedback (features visitors love that staff didn’t prioritize; frustrations staff thought they’d solved)
Visitor Studies Methodology
Academic visitor studies offer a research framework museums can adopt.
The visitor studies approach includes:
Observation. Tracking how visitors move through spaces, where they linger, which elements they skip. This complements feedback data.
Interviews. Structured conversations with representative samples, not just self-selected volunteers.
Focus groups. Small groups reflecting on their experience, revealing reasoning behind satisfaction or dissatisfaction.
Repeat visitor tracking. Following segments over time (annual members versus first-time visitors) to understand experience variability.
Demographic analysis. Does satisfaction vary by age, education, visit party size, or language? Visitor studies methodology captures these correlations.
Museums with visitor studies expertise integrate this rigor into their feedback systems. The most sophisticated institutions combine quantitative metrics (NPS, CSAT) with qualitative methods (coded feedback themes, observation, interviews) for comprehensive understanding.
Choosing Your Feedback System
The right measurement method depends on your museum’s priorities:
If you prioritize scale and response rate: Voice-powered feedback terminals outperform traditional methods. Expect 40-60% participation versus 2-10% for comment cards, while capturing richer data.
If you need cost-effective baseline measurement: Digital kiosks with simple rating scales work well. They’re affordable, scalable, and provide structured quantitative data.
If your audience is linguistically diverse: Voice feedback with real-time translation is essential. It’s the only method capturing feedback authentically from international visitors in their native language.
If you want deep insight on specific exhibitions: Combine point-of-visit QR code surveys for targeted feedback with periodic focus groups for deeper exploration.
If you want continuous improvement data: Real-time sentiment analysis and theme extraction (enabled by voice and AI) allow rapid iteration. You spot problems and opportunities within days, not months.
How to measure visitor satisfaction in museums explores voice feedback implementation in museum settings. For museums ready to modernize their feedback capability, SaySo’s feedback system captures authentic visitor voices at scale.
The Competitive Advantage of Better Feedback
Museums that systematically measure visitor satisfaction gain operational advantages:
- Programming decisions become data-informed, not staff-preference-driven
- Wayfinding improvements target actual confusion points, not assumed ones
- Accessibility upgrades address real barriers visitors face
- Membership retention improves as you demonstrate responsiveness to feedback
- Funding conversations feature hard data on visitor satisfaction and impact
The institutions leading museum innovation aren’t those with the most impressive buildings or expensive exhibitions. They’re the ones listening to visitors systematically and responding.
Conclusion
Traditional feedback methods—comment cards, exit interviews, post-visit email surveys—served museums well for decades. They remain useful for gathering some insights at minimal cost.
But they’re fundamentally limited. They capture only 2-10% of visitors. They skew toward extreme opinions. They miss international audiences. They generate unstructured data requiring manual analysis.
Modern feedback systems—digital kiosks, QR surveys, voice terminals—address these limitations to varying degrees.
Voice-powered feedback emerges as the most comprehensive solution. It captures richer data than typed surveys, reaches higher percentages of your visitor population, accommodates non-English speakers authentically, and provides real-time analysis enabling rapid response.
The museums and cultural venues leading their sectors aren’t measuring visitor satisfaction more frequently. They’re measuring it better—with methods that genuinely capture how visitors think, feel, and experience their visit.
That’s the measurement evolution your institution deserves.
Ready to capture authentic visitor feedback at scale? Explore how voice-powered feedback transforms museum insights, or learn about SaySo’s feedback system for cultural venues.