How to Measure Footfall in Retail: A Complete Guide to Counting Customers and Optimizing Store Performance
Introduction
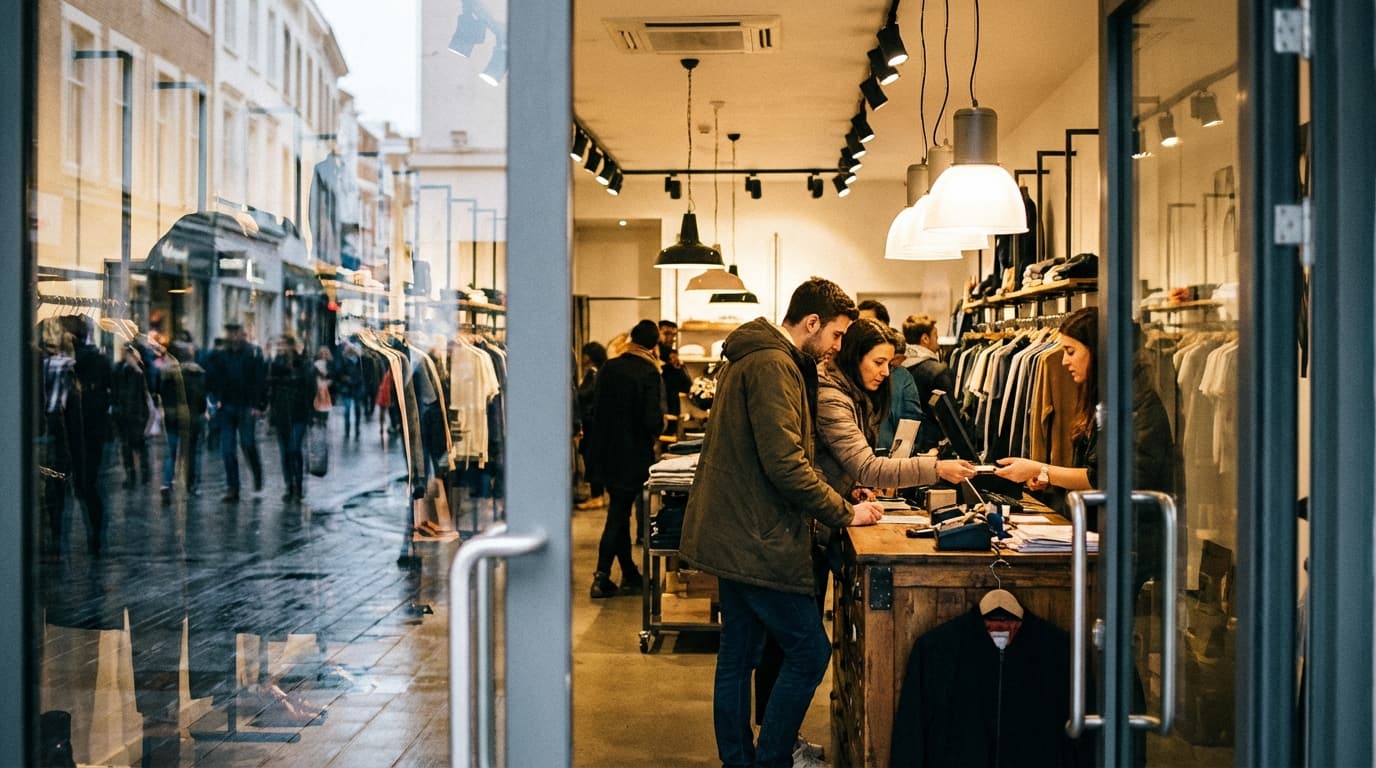
Every day, customers walk through your store's doors. But do you know how many? More importantly, can you track how many actually convert to sales?
Footfall measurement—the process of counting the number of people entering your store—is foundational to retail success. Yet surprisingly, many retailers still rely on guesswork, manual tallies, or incomplete transaction data to understand store traffic. This leads to poor decisions about staffing, inventory, marketing ROI, and expansion.
In this guide, we'll explore why measuring footfall matters, the technology options available, and how to choose a solution that fits your business.
Why Measuring Footfall Matters
Understand True Store Performance
Revenue and transactions tell only half the story. A store generating £50,000 per week in sales might sound successful—until you learn it attracts 2,000 visitors weekly (conversion rate: 5%) versus a competitor with similar sales but 5,000 visitors (conversion rate: 2%).
Footfall data reveals:
- Actual conversion rates (sales ÷ visitors × 100)
- Sales per visitor (total revenue ÷ visitors)
- Customer acquisition cost relative to foot traffic
- Marketing campaign effectiveness (did that promotion drive more foot traffic?)
- Peak and quiet periods (staffing and scheduling insights)
Without footfall measurement, you're making decisions blind.
Optimize Staffing and Labor Costs
Labor is typically 20-30% of retail operating costs. Knowing when your store gets busy allows you to:
- Schedule staff during peak hours (improve customer service, reduce wait times)
- Avoid overstaffing during quiet periods (reduce unnecessary costs)
- Maintain optimal staff-to-customer ratios
- Forecast staffing needs based on historical traffic patterns
A store with 500 daily visitors needs different staffing than one with 2,000—but only if you know the difference.
Improve Inventory Management
Footfall data helps balance stock levels with demand:
- High footfall with low conversion might indicate product placement or pricing issues, not lack of inventory
- Track which products attract browsers vs. buyers
- Reduce markdown losses by understanding what drives visits vs. purchases
- Identify slow-moving stock that ties up cash
Measure Marketing ROI Accurately
Marketing teams can now answer: "Did that £5,000 campaign increase store visits?"
- Track footfall before, during, and after campaigns
- Attribute foot traffic to specific marketing channels (social ads, email, local events)
- Calculate customer acquisition cost per visit
- Justify marketing spend to finance teams with visitor data
Support Data-Driven Expansion
When opening new locations, footfall metrics inform decisions:
- What's the catchment area's foot traffic potential?
- How many visitors do competitors attract?
- What store format (flagship, pop-up, small format) suits this location?
- When should the location break even?
The Problem with Manual Footfall Counting
Many smaller retailers still count customers manually. It sounds simple but breaks down quickly.
Why Manual Counting Fails
Inconsistency: Different staff members count differently. One person counts every browser; another counts only serious shoppers. Results vary by 20-40% depending on who's counting.
Time and Resource Intensive: Asking floor staff to count while serving customers divides attention and reduces service quality. Dedicated counters add to payroll costs.
Covers Only Operating Hours: Manual counting typically happens during staffing hours. What about before opening or after closing when people browse windows?
No Historical Comparison: Paper tallies don't automatically track trends. Comparing last week to last month requires manual data entry and spreadsheet work.
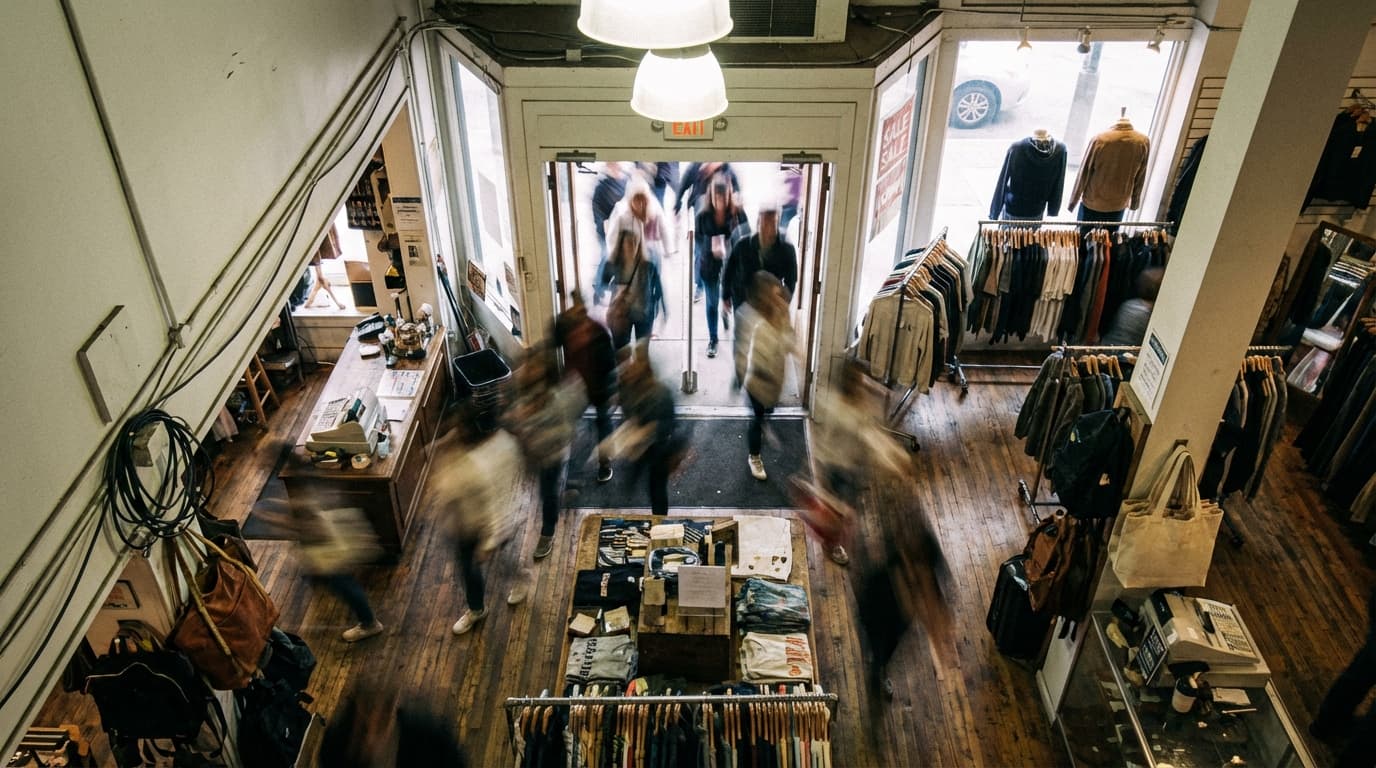
Can't Capture Dwell Time or Flow: Manual counting gives you one number (daily visitors) but misses valuable insights like peak hours, dwell time, or how many people just browse without entering.
Vulnerable to Human Error: Miscounts, forgotten days, and data loss happen. A sick staff member means no count that day.
No Real-Time Insights: By the time data is compiled, the day is over. You can't respond to slow periods with promotional staff or real-time adjustments.
Real-World Impact
A fashion retailer counting 500 customers manually per day might actually see 580+ due to miscounts. Decisions built on inaccurate numbers compound over time, leading to poor inventory, wasted marketing spend, and missed opportunities.
Technology Solutions for Measuring Footfall
Modern retailers have five primary options for footfall measurement, each with distinct advantages and limitations.
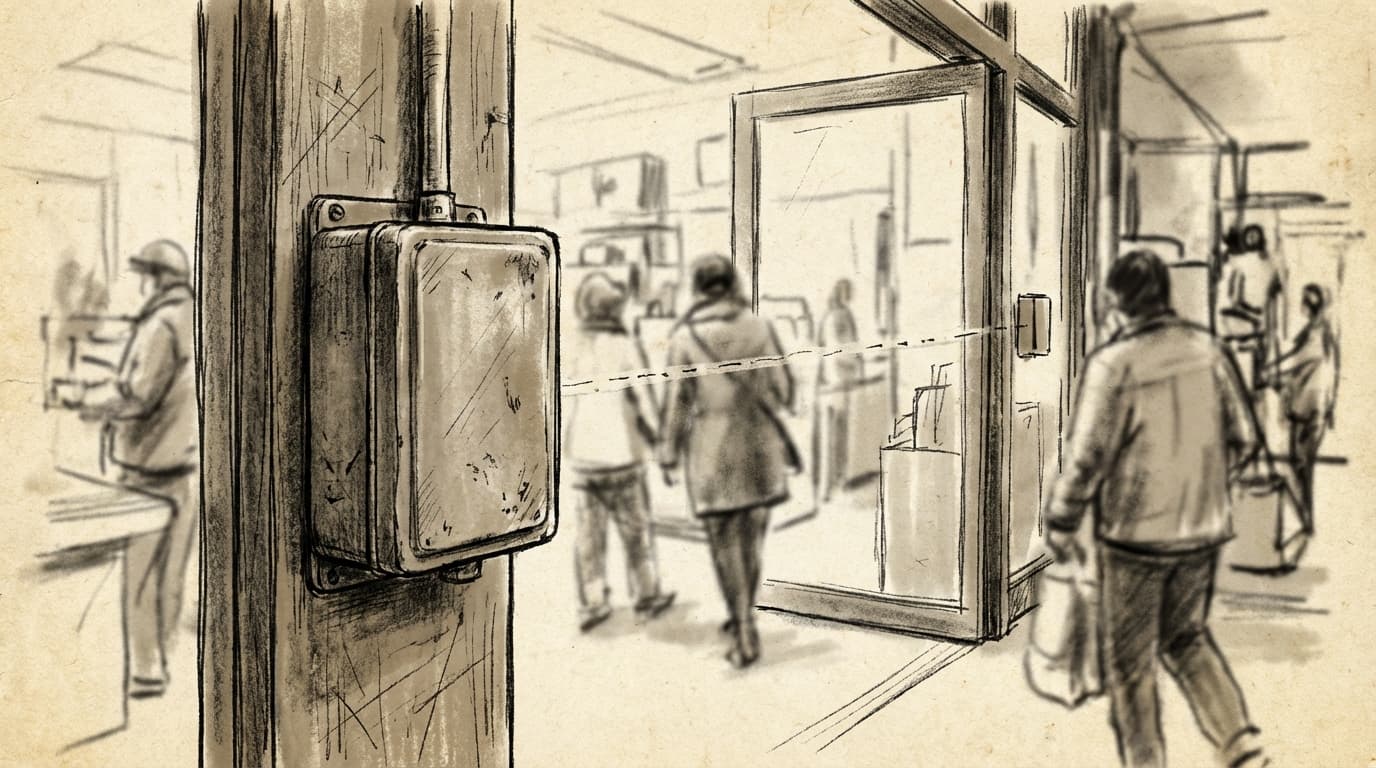
1. Infrared Beam Counting
How It Works: Infrared beams create an invisible light curtain across entry points. When someone crosses the beam, a counter increments. Beams are typically installed at knee or waist height.
Pros:
- Low cost (£500-£2,000 per entry point)
- Simple installation
- Reliable for single entries
- No privacy concerns (just counts, no recording)
- Minimal power requirements
Cons:
- Struggles with multiple people entering simultaneously (crowded times undercount)
- Affected by bright sunlight and reflective surfaces
- Can't distinguish entry from exit (requires directional setup, adding cost)
- No demographic data or dwell time insights
- No integration with wider analytics systems
Accuracy: 85-90% in controlled conditions, 70-80% during busy periods
Best For: Very small retailers with single entries, low foot traffic, budget-conscious stores
2. Thermal Imaging Sensors
How It Works: Thermal cameras detect heat signatures (human body temperature). As people move through defined zones, the sensor counts them. No visible light or cameras recording faces.
Pros:
- Works in complete darkness or bright sunlight
- Highly accurate in most conditions
- Distinguishes entries from exits (directional)
- Privacy-friendly (no visible recording)
- Captures some behavioral data (dwell time, zones occupied)
Cons:
- More expensive than infrared (£1,500-£4,000 per entry)
- Requires precise calibration and installation
- Can be affected by other heat sources (heaters, direct sunlight through windows)
- Limited integration with analytics platforms
- Struggles in crowds (similar to infrared)
Accuracy: 88-95% in most retail environments
Best For: Mid-size retailers concerned about privacy, stores with difficult lighting conditions, venues with multiple entry zones
3. WiFi and Bluetooth Tracking
How It Works: Sensors detect WiFi and Bluetooth signals from customer smartphones. When a phone connects to your WiFi or Bluetooth beacon, the system counts a visit and can track movement through the store.
Pros:
- Captures valuable behavioral data (dwell time, repeat visits, store zones visited)
- Can track repeat customers if they connect multiple times
- Integrates easily with existing retail systems
- Provides demographic insights if connected to customer data
- Relatively affordable (£1,000-£3,000 for store-wide coverage)
Cons:
- Significant undercounting (only ~30-50% of visitors have Bluetooth/WiFi enabled on phones)
- Privacy concerns (requires transparency and consent)
- Requires promoting WiFi sign-up (adds friction to analysis)
- Cannot distinguish multiple people sharing one signal
- Requires ongoing management of beacon placement and battery replacement
Accuracy: 40-60% actual visitor capture (not a counting method per se, but frequency measurement)
Best For: Retailers wanting detailed behavioral data, fashion and lifestyle brands with tech-savvy customers, locations where repeat customers are key
4. Stereo Vision Cameras
How It Works: Multiple angled cameras use depth perception to detect and count people. The system distinguishes bodies and counts entries/exits without identifying individuals.
Pros:
- Very accurate in most conditions (92-97%)
- Captures body movement and flow patterns
- Distinguishes entries from exits reliably
- Works in crowds
- Can measure dwell time and store zones
- Increasingly affordable as technology matures
Cons:
- Visible cameras raise privacy concerns (requires signage and policy)
- Requires good lighting conditions
- Initial setup and calibration more complex
- Integration with systems varies by provider
- Higher cost (£2,000-£6,000 per entry)
Accuracy: 92-97% in controlled environments, 88-94% in crowds
Best For: High-traffic stores, shopping centers, venues, large format retailers, luxury brands wanting premium data
5. AI-Powered Camera Counting
How It Works: AI-trained on millions of images detects humans in video feeds. Modern systems use deep learning to count people entering/exiting, measure dwell time, analyze behavior patterns, and even estimate demographics (age ranges, gender) without identifying individuals.
Pros:
- Highest accuracy available (96-99%)
- Rich behavioral insights (dwell time, heatmaps, queue detection, staff-customer ratios)
- Works reliably in crowds, difficult lighting, complex entry points
- Continuously improves via machine learning
- Single camera can monitor wider areas
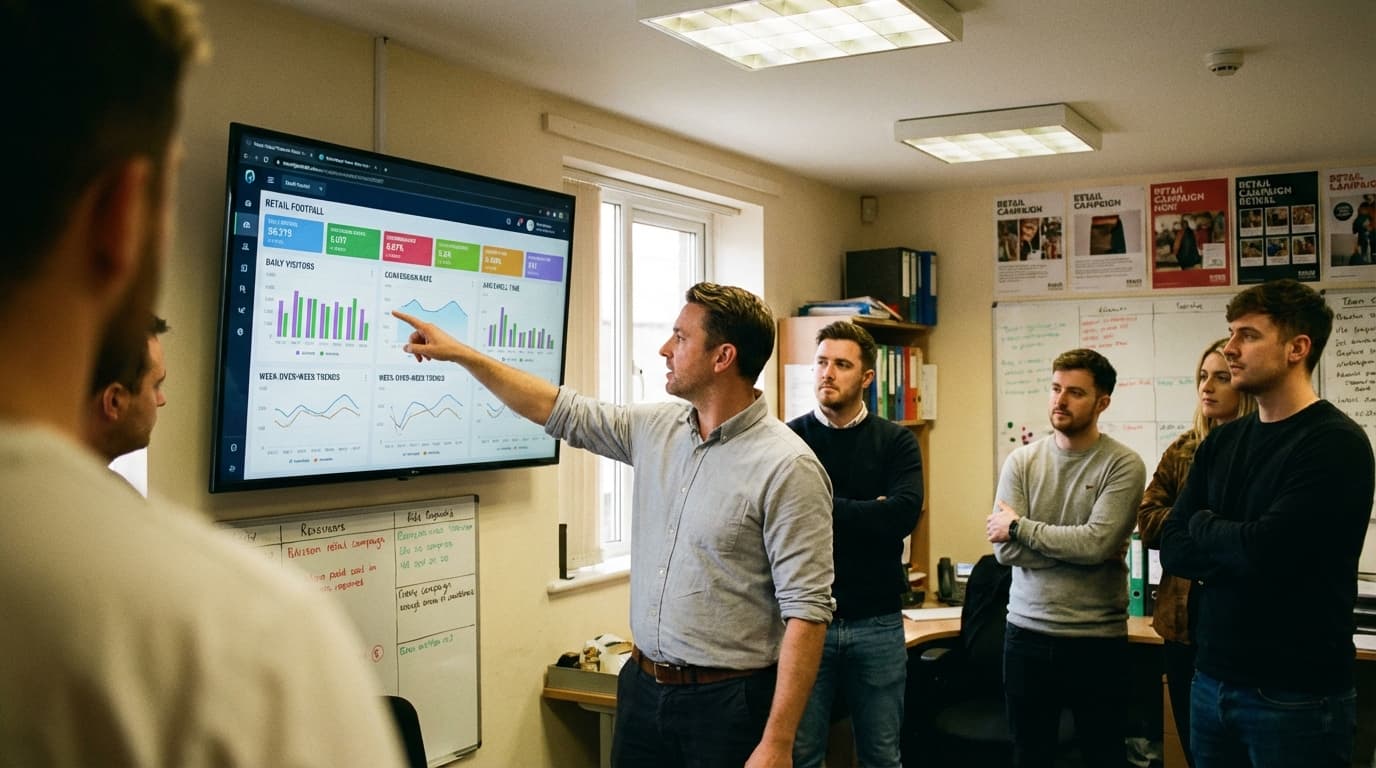
- Cloud integration provides real-time dashboards and insights
- Can trigger real-time alerts (long queues, understaffing)
- Privacy-preserving when configured properly (detects bodies, not faces)
Cons:
- Highest cost (£3,000-£8,000+ per location, plus subscription fees £100-£500/month)
- Requires quality internet connection
- Setup and calibration by specialists
- Perception of surveillance (despite privacy claims)
- Vendor lock-in (data often stored on provider servers)
Accuracy: 96-99% even in crowded, complex environments
Best For: Enterprise retailers, multi-location chains, shopping centers, venues, luxury retail, businesses where detailed analytics justify higher cost
Accuracy Benchmarks by Technology
| Technology | Simple Entry | Busy Period | Exits Detected | Dwell Time | Behavioral Data | Cost |
|---|---|---|---|---|---|---|
| Infrared Beam | 85-90% | 70-80% | No | No | No | £ |
| Thermal Imaging | 90-95% | 88-95% | Yes | Basic | No | ££ |
| WiFi/Bluetooth | 40-60% | 40-60% | No | Yes | Yes | £ |
| Stereo Vision | 94-97% | 88-94% | Yes | Yes | Basic | £££ |
| AI Camera | 98-99% | 96-99% | Yes | Yes | Yes | ££££ |
Note: Accuracy varies by installation quality, environment, and vendor. Always request case studies and on-site trials.
How to Choose the Right Footfall Solution
Selecting footfall technology isn't about picking the most advanced option—it's about matching your business needs, budget, and growth plans.
Step 1: Define Your Requirements
Ask yourself:
Scale: How many entry points do you have? A single-entry boutique needs different technology than a 5-entry shopping center.
Traffic Volume: Low-traffic stores (<300 daily visitors) don't need AI cameras. High-traffic venues (1,000+ daily) benefit from advanced accuracy.
Data Depth: Do you just need daily visitor counts, or do you want dwell time, behavioral patterns, and real-time insights?
Budget: What can you justify annually? WiFi tracking is cheaper upfront but less accurate. AI cameras cost more but provide ROI through operational insights.
Integration: Does your POS system, marketing tools, or property management system need to connect with footfall data?
Privacy Concerns: Are visible cameras acceptable in your retail environment? Does your customer base have concerns?
Step 2: Evaluate Your Environment
Lighting: Difficult lighting (sunlit boutique windows, dark venues) favors thermal imaging or AI cameras over infrared.
Entry Complexity: Single-door shops are easier to measure accurately with simple beams. Multi-entry, cross-floor locations need directional, sophisticated counting.
Crowding: High-traffic times with bundled entries favor AI or stereo vision. Low-traffic stores can use simple infrared.
Existing Infrastructure: If you already have WiFi networks or camera systems, expanding those technologies might be cost-effective.
Step 3: Consider Use Cases
Small Independent Retail (1-2 locations):
- Budget option: Thermal imaging (£1,500-£4,000 one-time)
- Mid-tier: Stereo vision (£2,000-£6,000)
- Premium: AI camera with cloud dashboard (£3,000-£8,000 + subscription)
Multi-Store Regional Chain (5-20 locations):
- Consider standardized platform (same technology across locations for consistency)
- AI cameras with central dashboard provide consolidated reporting
- Often justifies higher per-location cost through consolidated insight
Shopping Center or Large Format:
- Probably needs AI cameras (handles crowds, multiple zones)
- Zone-level counting helps optimize tenant mix
- Real-time staff deployment based on traffic
Venue or Transport Hub (airport, train station, stadium):
- AI cameras with heatmaps and capacity monitoring
- Real-time queue detection and flow management
- Often mission-critical (safety, capacity planning)
Step 4: Conduct Trials
Before committing:
- Request a 2-4 week trial in your actual environment
- Compare counted traffic against manual spot checks
- Test integration with your existing systems
- Evaluate the vendor's support and training
- Check references with similar-sized retailers
Step 5: Build Your Business Case
Calculate ROI:
Cost: One-time hardware + installation + annual software/maintenance
Benefits:
- Improved conversion rate tracking (even 1% improvement = significant revenue gain)
- Labor optimization (schedule staff efficiently)
- Marketing ROI clarity (justify advertising spend)
- Inventory optimization (reduce markdowns)
- Real-time operational improvements
Most retailers recoup footfall technology investment within 6-18 months through operational efficiency alone.
Implementation Checklist
Before Installation
- [ ] Audit all entry/exit points in your store
- [ ] Photograph entry areas (show to vendor for site assessment)
- [ ] Check internet connectivity (if cloud-based solution)
- [ ] Identify power sources near entry points
- [ ] Coordinate with IT on system integration needs
- [ ] Plan staff training schedule
During Installation
- [ ] Ensure technician properly calibrates system for your environment
- [ ] Test in peak and quiet times
- [ ] Verify integration with POS, dashboard tools
- [ ] Document system settings and access credentials
- [ ] Request staff training on reading and interpreting data
Post-Installation
- [ ] Monitor accuracy for first 2-4 weeks (manual spot checks)
- [ ] Establish baseline metrics (daily, weekly, monthly visitors)
- [ ] Set up KPI alerts and reporting
- [ ] Brief staff on how data will be used
- [ ] Plan monthly reviews of traffic trends
Common Mistakes to Avoid
Mistake 1: Choosing Technology Based on Upfront Cost Alone
A £500 infrared beam that undercounts by 20% is more expensive than a £5,000 accurate system that enables better decisions. Focus on total cost of ownership (hardware + installation + subscriptions + opportunity cost of poor data).
Mistake 2: Not Testing in Your Actual Environment
That thermal camera that works flawlessly in the vendor's demo might struggle with afternoon sunlight through your west-facing windows. Always request on-site trials.
Mistake 3: Implementing Without Staff Training
Staff who don't understand footfall data won't use it. Invest in training so your team can act on insights (staffing decisions, marketing planning, inventory management).
Mistake 4: Selecting Technology That Doesn't Integrate
A great footfall system that can't connect to your POS creates manual workarounds. Ensure the vendor integrates with your existing tech stack or can provide robust APIs.
Mistake 5: Ignoring Exit Counting
Many retailers only count entries. Knowing how many people browse without purchasing is valuable. Require technology that distinguishes entries from exits.
Mistake 6: Using Technology But Not Acting on Insights
The most common failure: implementing footfall tracking but not changing behavior based on data. Use insights to optimize staffing, improve store layout, and measure marketing effectiveness.
Mistake 7: Measuring Without a Baseline
Start measuring today, even if imperfectly. Year-over-year traffic trends require historical data. Don't wait for the "perfect" solution.
Conclusion
Measuring footfall is no longer optional for competitive retailers. Whether you choose simple infrared beams or advanced AI cameras depends on your scale, budget, and data ambitions. But every retailer benefits from accurate, actionable footfall data.
The question isn't whether to measure footfall—it's which solution aligns with your business needs. Start by defining requirements, evaluating your environment, and conducting vendor trials. Build a business case around improved decision-making (staffing, marketing, inventory) and you'll find footfall measurement delivers ROI quickly.
The retailers dominating today's landscape aren't just measuring footfall—they're using it to optimize every aspect of the store experience, from staffing to layout to marketing attribution.
Call to Action
Ready to measure footfall accurately?
Download the Footfall Measurement Buyer's Guide – a detailed framework for evaluating solutions, calculating ROI, and implementing footfall tracking successfully.
This free guide includes:
- Detailed technology comparison matrix
- ROI calculator (estimate payback period)
- Vendor evaluation checklist
- Implementation timeline and milestones
- Real-world case studies (fashion, grocery, beauty sectors)
[Download Now] and start optimizing your store with accurate footfall data.
Hoxton Analytics provides AI-powered people counting and footfall analytics for retail, transport, and venues. We help businesses understand customer behavior and optimize store performance with industry-leading accuracy.